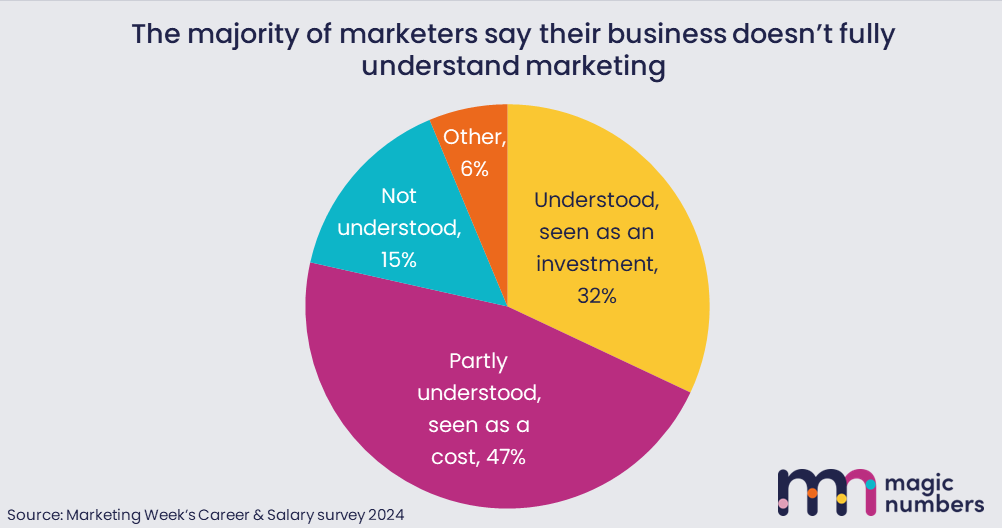
Grace’s 2024 Posts

Go Woke Go Broke

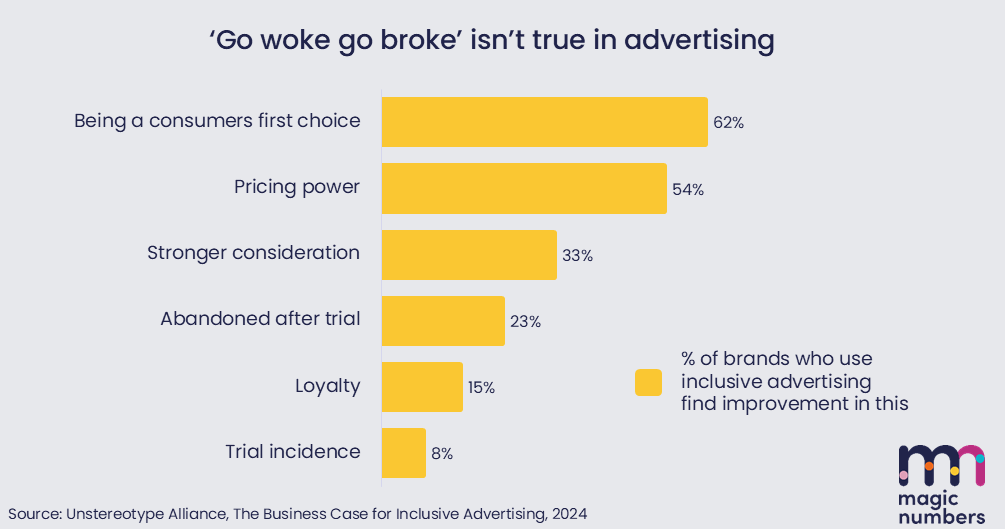
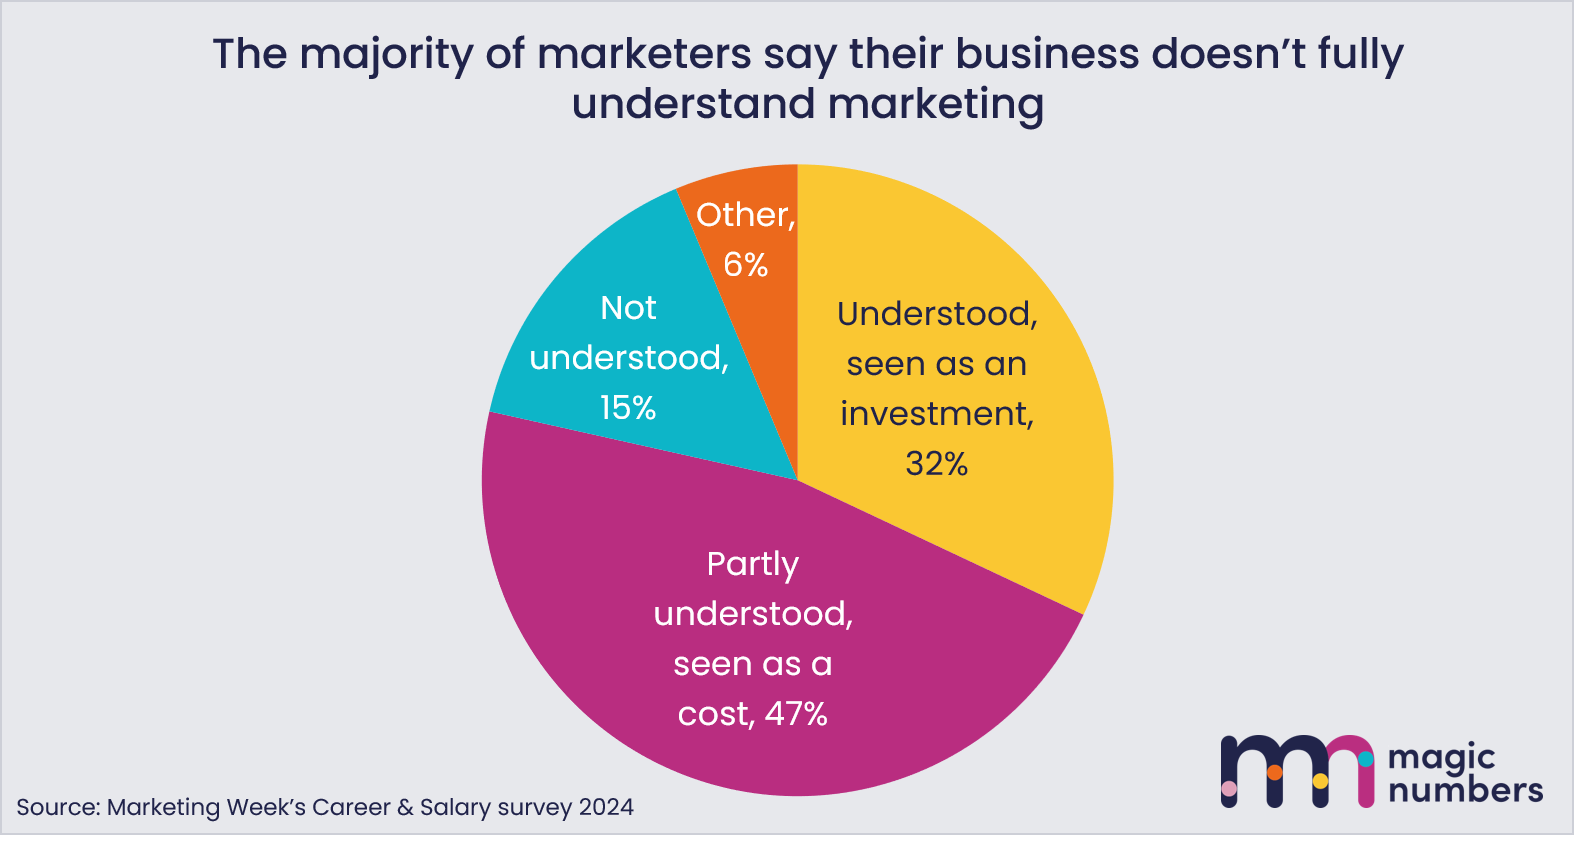
‘Go woke go broke’ is nothing more than a catchy line, according to this study that covers 392 brands in 58 regions.

‘Woke marketing’ is a derogatory term that describes ads that align with a cause that’s unrelated to the product. The theory goes that it doesn’t help the business sell more stuff, and it doesn’t do much for the cause either.

Boot’s 2024 Christmas ad is a case in point. It features a black Mrs Claus, and gender-neutral pronouns as she describes a gift: “Oh that’s very them!”. It’s attracted not just criticism, but even calls on daytime TV and in the press to boycott Boots.

Whether or not ads like this drive sales effectively is perhaps not the point. Inclusive advertising, just like inclusive TV programming and inclusive policies in schools, are a good thing in themselves for the progress they bring for our society. For my money, an ad like this is about as Christmassy as you can possibly get🎄️

But, dear friends, I know you do like a bit of effectiveness news.

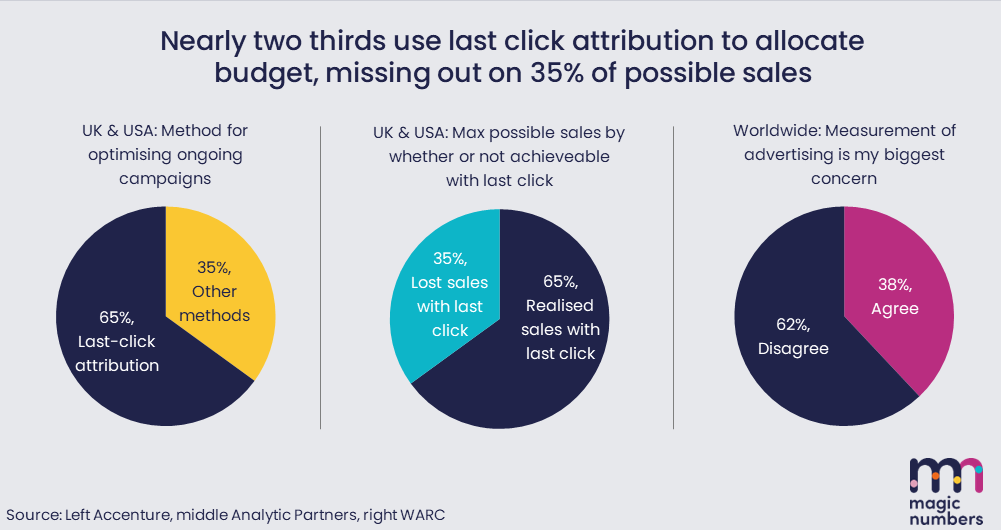
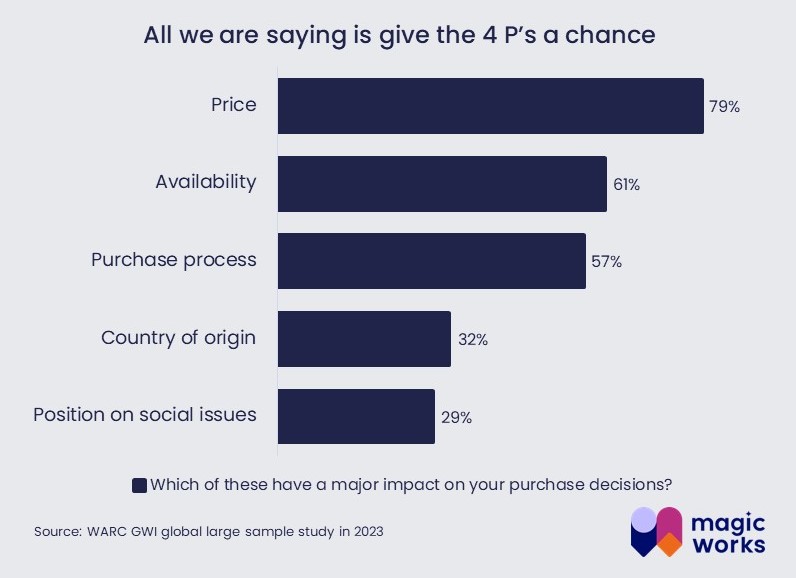
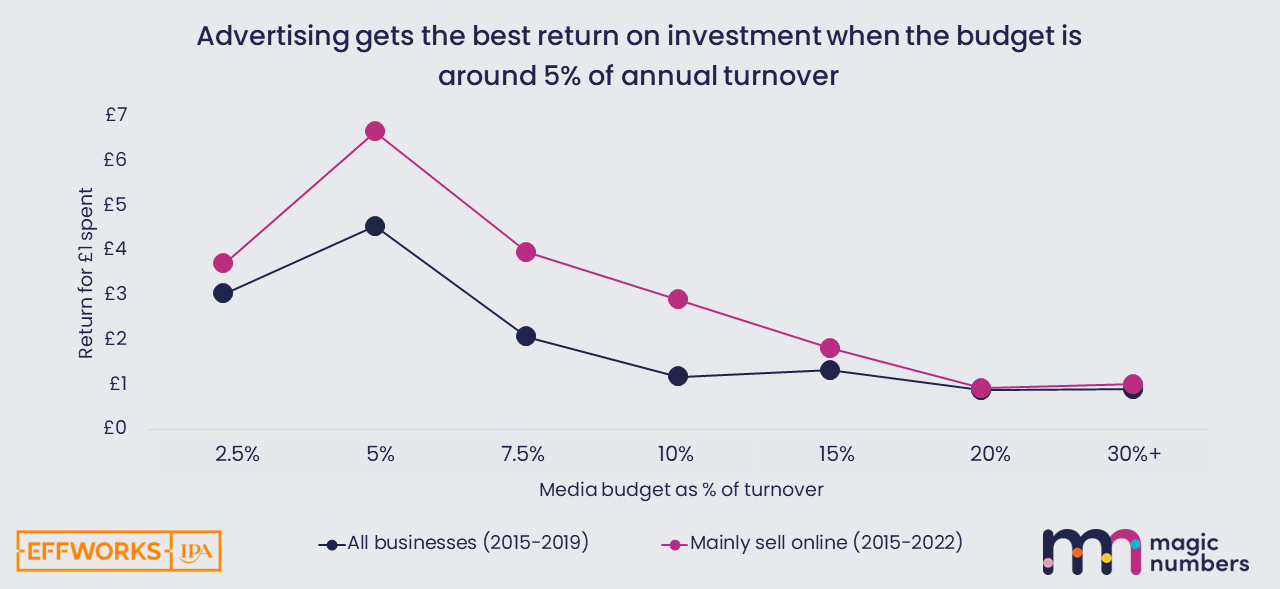
And despite the scepticism, the evidence is that ads with social issues, diversity, and inclusivity can be powerful.💡The chart shows that businesses who air them are more likely to be first choice, have higher pricing power, stronger consideration and improved trialling and loyalty outcomes.

Even though it’s survey data – and people often answer what they think they should say, rather than what they will actually do – the data points to the sceptics being wrong.

And if that’s not a jolly message for a jolly December chart of the month, I don’t know what is!

Want to be a whizz at building charts or become the expert balancing brand and performance marketing? Check out our courses via the navigation panel at the top of the screen.


For big advertising think small

Do you ever look at advice, examples, case studies and training and just think “it doesn’t look like the marketing world I live in” ?

I do.

Because the world has moved on from big advertising – big brands using big budgets, in big channels, with big ads on repeat.

That recipe, however effective it has been in the past, is now a small and declining part of what marketing means.

And what’s replacing it is a lot of little things, that have to work together to create something big. There are new lessons to learn.

I love Tom Roach ‘s article on this in marketing week today.

He has a very special ability to see what needs to change and communicate it in a positive way.

Must read. Follow the link:

https://www.marketingweek.com/tom-roach-big-advertising-think-small/


Villains, Heroes, Finance

People always say “learn to speak finance’s language”, but what does that actually really mean?

In my new article – link in comments – I set out a LOT of super practical things you can do, suggested to me by real life CFOs and finance directors.

⭐ Performance and retail media ads help customers to find you online, mainly doing an availability job. So, present them as operating expenditure – something that’s used up straight away – and show you’re minimising costs.

e.g. “Amazon is like a machine, we’ve got to spend about 20% of the retail price on ads there. You spend more, you don’t get much upside, you spend less, you see sales drop off. So, it’s like an OPEX”

⭐ Brand is different because here you’re buying something that pays back later. So present it as a CAPEX and show you’re maximising the payback and minimising risk.

There’s more in the article, including how to use scenarios to give finance a sense of security, the metric that allows your brand campaign to be compared to R&D or some other investment, and the move that turns your plan from risky into a safe bet.

Read the article here: https://magicnumbers.co.uk/articles/villains-heroes-finance/


LBB Online

Econometrics is the most reliable method for understanding the results of past marketing activity.

It gives you a cost-benefit analysis of everything you’ve done, so you can see what’s best to do next.

This interview with IPA (Institute of Practitioners in Advertising) and LBBonline – Little Black Book is a simple introductory guide, including information on:

• Why Martin Sorrell called econometrics the “holy grail”
• What the benefits of doing it are
• A really simple example of how it works
• Why it’s better than attribution, especially last click

So if it’s something you’ve always wondered about have a read, follow the link here:

https://www.lbbonline.com/news/answering-burning-econometrics-questions-with-dr-grace-kite/


Speaking gigs

There’s nothing better than that moment when you’ve just given a good talk that was super relevant for the audience in the room.

On this day, everyone had been properly listening, snapping away at the charts with their phone. They learnt something, and they laughed once or twice too.

I’ve got 3 new topics for a talk, based on new research I’ve been doing:

1. The future of brand building in a world of media fragmentation – a way forward that works by using lots of little exposures

2. A big picture view of retail media – what it does in media plans, what it doesn’t do, and where it’s all going to go

3. What CFOs want from marketing people and how to present payback in the way finance need to hear it if they’re going to sign off budgets

I hardly ever post about my speaking, but at the mo, these talks are burning a hole in my pocket and I’m up for sharing them. I do charge, but I also help event organisers fill their seats and sell their tickets.

If you want to chat about speaking engagements, drop [email protected] an email.


X vs BlueSky and Threads

The great X-scape?

As Elon Musk’s X has steadily reduced features and moderation in the name of free speech – and Musk has become more involved with Donald Trump’s presidential campaign – it seems that more and more users are becoming ex-Xers.

The chart shows the scale of the migration away from X.

Daily active users of X (the number of people actually opening the app and scrolling through it) has been on a long decline. It was down 30% in the UK by September this year compared to May 2023.

As events have transpired this week and Elon Musk has been appointed co-head of the Department of Government Efficiency (Doge), this decline has accelerated massively.

It is a loss to the media stack, particularly for B2B businesses that valued being involved in the professional conversations that took place on twitter.

So where should those businesses go now? Well, it depends on where the users are going!

Mark Zuckerberg’s Threads seemed like an obvious choice after its initial extreme growth back when it was launched in mid-2023. There were over 100m new members in its first week! But, Threads’ growth in number of users has stalled hard since.

By contrast, BlueSky, launched by twitter founder Jack Dorsey had a very slow launch, with essentially your-name-on-the-guest-list required to actually get on it.

Right now, though, it looks like BlueSky is winning out in having more appeal to X-iters looking to find a social media experience similar to what Twitter was before Musk’s takeover.

So, if it reaches a critical mass, it’ll be more able to step into the rather specific breach left by the little blue bird.

Have you had thoughts about ghosting this X?


Influencer Marketing

Is influencer marketing right for you?

The chart is from a big new survey by YouGov that asked over 10,000 respondents all around the world all about influencers.

It shows the topics where influencers are particularly, ahem… influential.
Around 60% of people find influencer content on travel, fitness, tech, and fashion useful. So, these products are good contenders for a strong effect of sponsored content on sales.

At the other end of the scale, the topics we don’t want at dinner parties are also the ones we avoid in conversation online: Politics and religion content is seen as the least useful.

But be careful, because culture matters. For example, in Indonesia, 86% of respondents find travel content useful compared to only 36% of Danish respondents.

It’s all part of emerging learning about how best to use influencers.

Other recent gems include a report by The Drum that Gen Z audiences trust influencers more than celebrities. And one to treat with some caution from the influencer benchmark report, which shows the average payback from influencers is $5.78 per $1 dollar spent.

If you’re not yet ready for big business brand-building, but worry you’re too reliant on performance marketing, influencers, just like online video can be a low-cost route to a new phase of growth.

Find out how to tackle it in my super practical, accessible, and no-nonsense Scaling Up Works course. Sign up by going to the courses page at the top of the screen or chat to Imogen for group bookings and questions via [email protected].


Retail Media Spend Marketing Week Article

It’s a slippery slope…

Moving money from traditional budgets into search ads on retailers’ sites, is like paying the rent out of your savings. It can only lead to poverty ahead.

It’s because retailers, and especially Amazon, control such a large share of product buying traffic, you have to be there if you want your product to be available to buy. This means they can charge what they like.

The chart shows that, aside from a COVID blip, it’s costing UK businesses more and more of their revenues and profits, each year.

The slippery slope comes because the only way to avoid continuing to pay as prices for this type of ad go up is to invest into your brand.

Because if people want your product before they get to the search page, any set of search results for the category which doesn’t include you is “wrong”.

And auction algorithms, which value relevance as well as advertising revenue, will allow you to be there for a reasonable price.💰

So don’t plunder your TV or out of home budget to pay retail-media rent in 2025. Instead, make the case now that this must be paid for out of the distribution or merchandising budget.

My latest article, link in comments, is all about this challenge, and how to navigate it in the coming years.

🚩 If you want to avoid paying for online ads that you don’t need and get the balance of brand and performance right, you should join our course Scaling Up Works! Sign up by going to the courses page at the top of the screen or chat to Imogen for group bookings and questions via [email protected].


Scaling Up Works starts today – onboarding week!

📢Scaling Up Works onboarding week starts today!

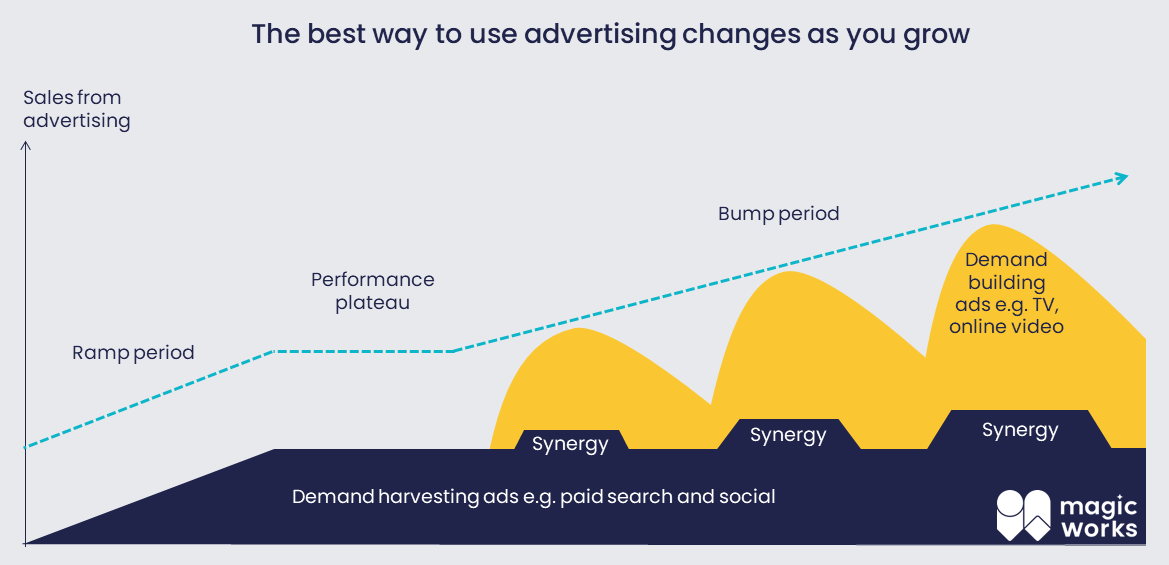
Want to balance brand and performance right and identify successful, low-risk, achievable routes into building demand?

Join us on my online training course Scaling Up Works.

It’s all about how to unlock a new phase of growth without the need for bigger budgets. And how to take a business whose love language is numbers through the transition that’s needed.

Including:

• Relevant frameworks
• Modern case studies
• Practical methods
• Benchmarks from the experience of hundreds of other businesses

It’s hands-on, practical training that fits in with your schedule.

So you can put your money where the magic is.

🚩Sign up by going to the courses page at the top of the screen or chat to Imogen for group bookings and questions via [email protected].


ROI to get your budget signed off

If you want a bigger marketing budget you’ve got to be able to talk turkey🦃

Marketers who measure and report return-on-investment are 1.6 times more likely to get a bigger budget.

Put yourself in your CFO’s shoes. He or she isn’t a baddie, just a practical numbers person that wants to do the things that’ll make the company grow and avoid taking too many risks.

The job is to adjudicate on an inbox full of 100 different things the company might buy, from machines in the factory, to an R&D hire, to a better fleet of delivery vans.

And every time something is approved it comes out profits and makes that all important P&L look worse, at least for a time.

The decision to approve is about two things: The likely payback and the chances that the person asking the money will manage this expenditure well.

Measuring ROI ticks both of those boxes because it not only quantifies the benefits of marketing, it also shows that you’re doing the work to learn and improve how you do it.

🚩If you want to learn more about advertising ROI, including how to do a rough estimate for yourself, how to commission analytics for an accurate read, and how to avoid pitfalls, you should join our Data Works course.

Sign up by going to the courses page at the top of the screen or chat to Imogen for group bookings and questions via [email protected].


IPA effworks tool

New and fresh from the IPA Effectiveness Conference! A free tool, to help you huddle with finance and come up with the best possible 2025.

Finance are not the baddies. They care about doing the best for the business, perhaps even more than you do.

But they get soooo many business cases for spending the company’s money and it’s a task to prioritise all the options.

When you put forward your marketing plan, finance has to decide whether that’s a better use of the money than something else.

So, show a bit of sympathy for the devil…. ahem, no… some empathy for finance. And help them out.

Our new tool, jauntily named “compare the cashflow” uses a framework that finance love – called discounted cashflow – to make it super easy to compare a media plan to an R&D project, or a new factory.🏭

Depending on your category, media mix and creative quality, it gives you an estimate of expected revenue over the next three years and accounts for cashflows in the future being worth less than today.

It then compares against another investment of your choice. Just work with finance – they don’t bite – to input the expected return and risk level and let the tool do the rest.

🚩Link here: https://bit.ly/3YjkyYS to a bundle of useful stuff. The tool itself, a little video to help you use it, and my slides from the conference.


Creative quality

Better creative, better ROI. Simples!

The chart above shows that there really is something about ads themselves that determine whether campaigns will pay back, and if so, how much.

System 1’s star and spike scores are established before ads even air, they measure what audiences feel when seeing an ad, and, as the chart shows, that predict payback.

The chart comes from a study with WARC, but we’ve seen it at magic numbers in our econometrics too.

Like the FMCG that had three different creatives before, during, and after COVID-19:

• The first, pre-pandemic, had close ups of people using the product, it had a weak creative quality score, and in econometrics a short-lived effect and weak ROI
• The second was about how this business was mucking in to help in the pandemic. It had a good creative score, a longer-lived effect and a middling ROI
• After covid, with a new CMO and a new agency, the third campaign was full of family stories and it had happy music. It had a great creative score and a stonking ROI.

So, here’s the useful bit, the thing you can do differently: Make great ads.

If you don’t know how, my course Scaling Up Works won’t be much use to you. Try Orlando Wood’s course or James Hurman‘s course.

Scaling Up Works is for people who need to get this sort of campaign agreed in the first place, and need to choose the right media channels to use, for the perfect mix of brand and performance.

Sign up by going to the courses page at the top of the screen or chat to Imogen for group bookings and questions via [email protected].


IPA awards – between us and AP

They don’t do an award for numbers-geeks agency of the year. But if they did, magic numbers/Analytic Partners would probably be it.

Last night at the IPA (Institute of Practitioners in Advertising) awards, our clients took home 1 golds, 2 silvers, and 2 bronzes, along with the Broadbent special prize.

It means a lot.

The technical judges are sceptical, fierce and working hard to pick holes. So when our work stands up in that forum, you can believe its because we get the numbers right, even the super complex ones.

And you can believe that the marketing our clients do, with our advice in the bag, really really works.

So congrats to Yorkshire Tea + Lucky Generals + Goodstuff for their gold, to McDonald’s + Leo Burnett UK and VCCP + Cadbury UK for their silver and Broadbent prize. And well done Müller UK & Ireland and VANGUARD INSURANCE too for their bronzes.

In the pic are the fabulous contributing authors our side Joy Talbot, Carly Greenfield, Kevin O’ Farrell, Luke McParland


Data Works starts today – onboarding week!

It’s onboarding week for my course Data Works; the “how to use” guide for marketing data!

In modern marketing, data matters. Because if you’re stronger with data, you’re able to see the things that are right to do.

And, if you want your ideas to be credible, convincing, and compelling you need data.
But it doesn’t have to be rocket science. You can be great with data even if you didn’t like maths at school.

This course makes data doable.

It covers things you should do to make sure your marketing is the best it can be. Including…

• Using data wisely and avoid being misled
• Presenting data in an easy-to-understand way📈
• Spotting issues scuppering your marketing
• Harnessing hardcore analytics

It’s hands-on, practical training that fits in with your schedule and you’ll have lots of support from the lovely team at magic works and me.

So you can get to grips with data and give your marketing the magic touch.

🚩Sign up by going to the courses page at the top of the screen or chat to Imogen for group bookings and questions via [email protected].


ITV regional testing

There’s a subtle effect of being on TV – via the Google auctions – that most people don’t know about.

It’s no secret that pound for pound TV often comes up in econometrics as one of the best channels for delivering visits to your site and converting them at scale.

So, its no surprise that this finding was confirmed when ITV carried out 30 rigorously designed regional tests. The chart shows that, on average in these experiments, running a TV campaign brought a 23% increase in site traffic and a 33% increase in conversions.

The tests also revealed a less obvious effect, working in the background.

They showed that TV actually influences the paid search auction.

In fact, a TV campaign makes you much more likely to appear at the top of brand search term auctions, to the tune of an extra 41%.📺

This means businesses that buy TV are more likely to appear in the top slot on Google when people search for them, and they pay less, per click, for their customers’ journeys through the search environment.

The success of media channel is often considered in a silo. Did it drive an uplift in conversions or awareness or some other similar KPI? Indirect effects and synergies are rarely fully taken into account.

A good measurement framework will set you up to understand both direct and indirect effects of your marketing mix. My Data Works course teaches you how to set up your MMM in a way that captures all of these. With killer charts, stats and more it’s the “how to use” guide for marketing data.

🚩Sign up by going to the courses page at the top of the screen or chat to Imogen for group bookings and questions via [email protected].


Marketing misunderstood

Two thirds of marketers say their business doesn’t fully understand marketing.

That’s scary if it’s true, but data in charts doesn’t always mean what you think it means.

Maybe the truth behind this particular pie is that the business does understand, they just don’t agree.

Marketers – and particularly those that understand the benefits of brand building – try to rebrand advertising spend as “investment”. When you buy it, they say, you purchase an asset – positive associations in people’s minds. That asset pays back over time in future sales.

The trouble is, advertising quite literally *is* a cost on the P&L.

It’s not an asset on the balance sheet, like the laptops, desks, and factory machinery. In the accounts it doesn’t register as something that’s owned. It can’t be sold.

Telling someone senior who understands the mission to get profit in the actual accounts that will actually be submitted to companies house that it’s investment might actually not be helping.

Maybe it’ll confuse that person, or it’ll make them think ‘stupid marketing people just don’t get this business’.

So maybe, just maybe, this is one where it’s not worth fighting a battle over the terminology, but instead refocussing on explaining the benefits of incurring marketing costs.

And if you want to do that using killer charts that really do represent the truth of the matter, check out our training course Data Works.

🚩Sign up by going to the courses page at the top of the screen or chat to Imogen for group bookings and questions via [email protected].

*New evidence alert*

I’ll be at the IPA (Institute of Practitioners in Advertising) Effectiveness Conference on Wednesday 9th October!

My talk will be sharing new research on how to demonstrate the value of your marketing plans to the audience that matters most: Finance.

That means:

• A whole lot of advice from 6 CFOs on how to get your pitch right
• A tool that helps you work with finance to compare marketing to other investments
• All wrapped up in a lovely talk just after the lunch break on 9th October

Join me in person at the conference in London, or stay tuned here as IPA always make the sessions available for free online after the conference.

Watch my talk here: https://ipa.co.uk/knowledge/effectiveness/ipa-effectiveness-conference-2024/future-value-of-present-spend/


Let’s talk branding

Had a great time chatting to Stef Hamerlinck on Let’s Talk About Branding Pod. We covered:

• What does effectiveness really mean?
• What measurement reveals about creativity
• A little bit about the future of brand building
• And loads more!

🚩 Stef kindly allowed me to mention my courses on the lovely podcast. And I hope you don’t mind me mentioning it here! Check out Scaling Up Works which teaches you how to balance brand and performance marketing, find wasted spend and get your budget set up for effectiveness.

Link at the end to read more and book today, or chat to Imogen Howard for group bookings and questions via [email protected].


Pubcast – goosebumps!

Want to find out what Les Binet is getting goosebumps about?

Link to our Pubcast video here: https://lnkd.in/eT8mYk9F. That’s right, it’s a podcast, but from a pub. It’s got beer! It’s got giggles! And yes, it’s got lots of marketing effectiveness genius.🍻

And if you want to build an effectiveness plan for your own business, that’s something you can’t get from a podcast, even one in a pub.

🚩Instead, you need one of our courses starting soon in October. Sign up by going to the courses page at the top of the screen or chat to Imogen for group bookings and questions via [email protected].

Watch the video in the original post here: https://www.linkedin.com/posts/grace-kite_marketing-data-training-activity-7244272164277747713-RIh-?utm_source=share&utm_medium=member_desktop


Lots of littles

Great acts of brand building now have to be made up of a lot of little things.

Because there’s no going back. The platforms that people scroll through, only catching a glimpse of your ad, are here to stay.

And the generation that’s grown up with content that suits them exactly isn’t going to start watching please-all programming in their millions.

It means that smaller reach per placement and smaller attention per ad is not going away.

But all hope is not lost.💡Because the modern media stack includes numerous ways of communicating that have been shown to work well together.

If you can get “matching luggage” – ads that look and feel the same, but are also tailored to the platforms concerned, you can get the benefits of a “lot of littles” campaign.

Because of synergies, going from using 1 channel to using 5 brings 35-65% more ROI and double the effect on brand metrics.

No single media channel gets everyone for 30 glorious seconds, but together, the stack delivers a critical mass of smaller exposures, without getting boring… and, if you can manage creative and media so it all feels consistent, it works.

My latest article, read here: https://lnkd.in/eQJrapuM, is all about this route ahead, and what you need to know to use it in 2025.

🚩If you like it, you’re bound to like my courses… Sign up by going to the courses page at the top of the screen or chat to Imogen for group bookings and questions via [email protected].


Event announcement

Did you know there are 6 ways a chart can be shonky?

If you want to learn what they are, come to our free 30 minute masterclass with Tashan Nicholas and me on the 24th September at 14:00.

You’ll leave immune to making the wrong choice, and clear on what not to do in your own charts.

Click here to watch it back.


Spend calculator

Free and simple online tool to help you use Econometrics/MMM!

I love Econometrics/MMM. Not in that cringey way you see on CVs, where people claim a passion for work to impress a future boss. But it in an unabashed, geeky, I know it’s not cool but I can’t help it, way.

It’s just a brilliant tool for learning how the world works using data. And it solves all the well-known problems with last-click attribution. And it doesn’t need 3rd party cookies.

I want everyone to be able to use it in 2025, so, with the team at magic numbers I’ve made a tool that will help you use it during this Autumn’s annual planning.

It does 2️⃣ things:

1. Is for smaller businesses – the tool tells you if you’re ready for econometrics/MMM, by assessing whether you’re spending enough to get a good read with this method.
2. Is if you’re already using econometrics/MMM and experimenting with new media channels. The tool tells you how much you need to spend on that channel for econometrics/MMM to give you a good read.

Give it a go here: https://lnkd.in/eycDxPNM, and pop your thoughts and questions in the comments. We didn’t write a manual yet, but we’re here to support you as you get stuck in.

So you gave it a try and have some stonking data to use, but you need to know what to do next. My course Data Works covers all the different avenues you can take after using this tool and even uses this in the homework.

🚩Sign up by going to the courses page at the top of the screen or chat to Imogen for group bookings and questions via [email protected].


Joy at Nottingham event

Exciting news, Senior Director Joy Talbot will be speaking at Hallam‘s Nottingham Digital Summit on Thursday 19th September.

As online shopping surges and digital ad spend continues to increase, it’s crucial for businesses to be easy to find online. It’s the end of brand vs. activation as we know it 💡

Join Joy to learn what this means for advertisers and how you can navigate the new budget allocation challenge: when to spend on Google vs Amazon.

Enjoy the summit! NottmDigital

Influencers

People trust influencers.

The set of pies below shows that around three quarters of people who follow creators that promote products or brands like the recommendations they get.

They believe the influencers they follow are on their side.

That they promote affordable, reliable, and good quality products, and that they do it because they’re looking out for the best interests of their followers.

And, just in case you were wondering whether c.75% trust is good for product recommendations, I can confirm, it is.

• It’s way better than celebs see. The proportion who trust celebrity endorsements is a paltry 1-3%.
• In fact, it’s pretty close to the degree of trust people place in a recommendation from a friends or family member at 92%.

It means that these people offer your business a modern way to access the benefits of positive word of mouth.

And that means you have an option for brand building in 2025 even if your budget won’t stretch to luxuries, or your audience is young and not watching TV any more.

If you want to find out more about brand building online, including strategies that won’t break the bank and what’s worked for other businesses, check out our training course Scaling Up Works.

🚩Sign up by going to the courses page at the top of the screen or chat to Imogen for group bookings and questions via [email protected].


Cost of dull

Are your ads boring?

Odds are, most people probably think so. According to research by System1, 52% of TV ad viewers in the UK feel neutral when seeing a TV ad.

That means they feel nothing.

No happiness, no surprise, no anger. Not even a little bit of good old fashioned British contempt.

Nothing.

Does this matter? Surely an ad doesn’t always need to be exciting?

Make people aware of the product and tell them what it does and they’ll buy it, right?

Peter Field looked at this very question using IPA (Institute of Practitioners in Advertising) data, comparing the business effects of rational (dull) campaigns versus the most emotional (not-dull) campaigns and found a big difference.

The chart above shows the results. On average, brands are wasting £10m by running a dull TV campaign.

This is because, for a dull campaign to be as effective as a more exciting alternative, you have to spend £10m more on it to drive the same level of business effects.

And that’s just an average, for some categories, such as retail, it can be almost double.

So, what do they say you can you do to be less dull? One key area is to stop trying to cram so much information into your ads, this can leave viewers bored or confused!

There are a few more pointers in the paper worth checking out to help stop the oncoming ‘dullocalypse’, but if you’re thinking about branching into brand activity and how to balance with performance, our Scaling Up Works course has lots of tips and tricks for how to execute your campaigns.

🚩Sign up by going to the courses page at the top of the screen or chat to Imogen for group bookings and questions via [email protected].


Budget simplicity

Is your budget set at the right level this year?

We’ve done the work to establish a good rule of thumb for how to set your advertising budget relative to the size of your business if the objective is to maximise ROI.

The chart is from the ARC database – a joint initiative between the IPA and magic numbers to bring hundreds and hundreds of econometrics findings from 6 econometrics shops together.

It shows the optimal % of turnover you should devote to advertising if you’re an online business and you want to maximise ROI. It’s about 5%, and for online businesses the ROI is higher at that optimum than it is for bricks and mortar.

But do you know what else we found? It’s that the same finding was there in 2 other reputable sources – in Nielsen’s ROI study, and in an investigation by Paul Dyson. All three studies landed on spending 5-10% of turnover on advertising for the highest return on investment.

This chart is taken from our course, which is all about putting your money where the magic is. The right size budget and the right mix of brand and performance marketing.

If you like using a benchmark, meta study, or rule of thumb to make the right decisions *and* successfully sell them in to your bosses, learn more on our Scaling Up Works course.

🚩Sign up by going to the courses page at the top of the screen or chat to Imogen for group bookings and questions via [email protected].


SXSW performance vs brand

For high ROI evolve your marketing strategy as the business grows.

This new killer chart – based on econometric evidence from magic numbers and other reputable providers- shows that, in the early stages, a performance heavy mix is what delivers the highest returns.

It’s because, when you’re a start-up, performance marketing is enough. You can get growth just by reaching people who are ready to buy and introducing them to your product.

But the chart shows that, as you grow, the ROI from a more balanced mix gets better, and eventually overtakes the payback from sticking with performance.

Bigger businesses leave money on the table if they don’t diversify into media channels with more reach, richer creative, and the sound on. The biggest wins for as you grow come from brand building.

Change is hard… Performance marketing seemingly provides tangible results like clicks, visits, and conversions. And you don’t pay unless real people do those real things. It’s no wonder the big bosses love it.

🚩Our course Scaling Up Works will help you lead your business through this journey. It includes practical things you can do with your own data to release cash for new things and ensure you get those new things right. Sign up by going to the courses page at the top of the screen or chat to Imogen for group bookings and questions via [email protected].


Facebook is getting older

Facebook’s got creaking knees and Instagram’s wondering why it can’t party like it used to.

Yep, Meta’s audience is getting older.

It might not surprise you much to know that Gen Z’s Facebook usage has more than halved from over 30% in 2019 to 14% in 2023.

But did you know that Instagram is also ageing? Pre-covid, Insta was quite young, and with both platforms in your social buy, Meta could offer coverage of all age cohorts.

But that’s changing. In the chart of Gen Z social media usage above, Instagram has dropped from being the number 1 platform in 2019 to number 3 in 2023. And Facebook from 4th to 6th behind YouTube and X (not shown).

🎉TikTok is the big success story with this age group. Showing the power of sound on short form video, it’s gone from last to first in only 4 short years.

But that doesn’t mean the future is entirely bleak for Meta, just that we need to use it in different ways now.

For the right audience, and using the right objectives, we at magic numbers have measured strong effects of Meta ads many times.

There are many ways of working out how best to allocate your media budget, many of which don’t need expensive research, but can be tackled with data you already have in simple frameworks.

My course Scaling Up Works covers this. It’s all about how to get the mix of performance and brand right and unlock a new phase of growth.

🚩Sign up by going to the courses page at the top of the screen or chat to Imogen for group bookings and questions via [email protected].


Setting expectations

There’s a short-term benefit of being the oldest in your year at school… but just like some media channels that look great at first, the initial head start disappears as time goes by.

The chart shows that the month kids are born in affects the grades they achieve.

Kids born in September – so that they’re the oldest in their class – are much more likely to achieve expected grades, in their early school years. But kids that’re born in August, and youngest in the class, find it much harder to make the grade.

So, September babies get a head start, but here’s the thing: It reduces as they and their classmates get older. By the time they’re grown up, there’s no evidence that birth month matters.

This is exactly the same for media channels. Some are born lucky so that their biggest sales effect happens straight away, but others, which are equally as good, and often better, take time to blossom.

🔍We see it time and time again at magic numbers. Paid search, for example, nearly always beats TV on sales performance per £1 spent in the week of airing. But the head start typically disappears by the time 4 or 5 weeks have passed.

Businesses that don’t have the right context or expectations for the different channels in their media mix make short-sighted decisions, and it turns out, over time, that these aren’t the best choices.

If you want to get the mix right, and get your business on board, check out my course Scaling Up Works it’s all about unlocking a new phase of growth and is full of practical tips and tricks along the way.

🚩Sign up by going to the courses page at the top of the screen or chat to Imogen for group bookings and questions via [email protected].

Election – Cartograms are better

Don’t be misled by a colourful map… it’s very easily done.

A few weeks back, Labour recorded a landslide victory in the general election, but that doesn’t look to be the case according to the chart on the left.

You could easily conclude, looking at it, the Tories actually won!

But why is this the case?

Constituencies are far from evenly distributed around the UK and there tend to be more in areas with greater population.

Cities, therefore, are packed with lots of smaller constituencies which you can’t see on geographically correct maps, because they’re all on top of each other.🏙️

Cartograms, like the map on the right, fix it because they standardise constituency area.

All constituencies are worth one seat no matter how big they are, so making their size in the picture equal just makes more sense!

The right-hand side in our diagram shows a better visualisation of the election results data. Where the vast majority of inner-city seats were won by Labour, there is now much more red.

Have you been misled by any other coloured maps like this? Are you sure?

🚩Interpreting, visualising and communicating data is just as important in marketing as it is in politics. If you want to get better at it, you should check out our course Data Works. Sign up by going to the courses page at the top of the screen or chat to Imogen for group bookings and questions via [email protected].


Swiftenomics

Taylor your marketing with ‘Swiftenomics’.

Swifties (Taylor Swift fans) have flocked to tour locations from all corners of the world for a chance to see ‘Tay Tay’ perform.

And these non-resident Swifties need places to stay. The chart shows a correlation between the Eras Tour tickets being released and searches for Edinburgh hotels increasing.

For performance marketers in hotel businesses, this might look like a sudden improvement in the success of the performance marketing strategy. A marketing ‘Love Story’.😉

They might see cost per acquisition suddenly fall, return on ad spend increase, and cost per click drop. Website visits might suddenly spike.

But what happens when Taylor leaves town? After the tickets are released, you can see on the chart that there’s a steady decrease in hotel searches from August – talk about ‘Cruel Summer’!

And for our hotel performance marketer? Now the dashboards look a little different. Like suddenly the strategies aren’t working so well.

The marketing tools haven’t changed. It’s just that they have less relevant demand to work with, and search marketing can’t generate demand. It can only harvest it.

So how do you fill this ‘Blank Space’? You wouldn’t want to become the ‘Anti-Hero’ of your marketing department.

In our course Scaling Up Works you can learn more about this with practical solutions and modern case studies. You’ll see how to balance brand and performance marketing, remove wasted spend and allocate your budget to get the best bang for your marketing buck.

🚩Sign up by going to the courses page at the top of the screen or chat to Imogen (our in-house swiftie) for group bookings and questions via [email protected].


Skills survey

The biggest skills gap in marketing is data and analytics, that’s according to over 3000 marketing people in Marketing Week’s survey.

It’s because people who get into marketing aren’t motivated by looking at numbers, they choose this career because it’s:

• Creative
• About people
• Not rocket science
• Cool

But these skills matter, because no-one makes a decision without data any more.

People who have a good idea and know how to support it with a killer chart or stat are getting their good initiatives off the ground.🚀

Like the big financial services business that is using data to help rebalance their media budget away from spending a small fortune on search. The data reveals it’s a good idea, and it also helps their performance marketing team see that they’ll benefit and not be undermined.

The data makes it easier to do the right thing because the costs and benefits are known.

But training is underutilised in marketing. At only 23.9%, the UK has one of the lowest proportions of trained marketers in the world. That’s less than 1 in 4 marketers!

Our course Data Works is the “how to use” guide for marketing data. It covers building and understanding killer charts and stats so you can communicate them to cause change.

🚩Sign up by going to the courses page at the top of the screen or chat to Imogen for group bookings and questions via [email protected].


Podcasts

Are you using podcast ads?🎙️The data suggests you probably aren’t, but that you probably should.

The chart shows podcast listeners have grown massively over the past few years, and they’re expected to keep growing.

As many as 12 million people spend an hour a day listening to podcasts. And they pay attention. There are so many different topics, people can listen to the exact thing they’re interested in, and businesses can choose something that fits exactly with their brand.

We’ve seen good results amongst a number of magic numbers clients using the channel too. For example, one financial services client found podcasts to be the number 1 bang-for-buck channel in a varied media mix… We recommended testing higher budgets.

So why is it that according to Digital Ad Exchange only 18% of UK advertisers use podcasts in their plans?

That’s less than 1 in 5.

More than 80% may well be missing a trick!

If you want to know how podcasts could work for you, our Data Works course teaches you how to successfully commission regional tests and MMM.

And it teaches the tips and tricks that the best data storytellers use to land their points with the powers that be.

🚩Sign up by going to the courses page at the top of the screen or chat to Imogen for group bookings and questions via [email protected].


Measurements a mess

Measurement’s a mess!

Nearly two thirds of advertisers in the UK and USA still rely on last click attribution to optimise campaigns.

And that’s not just a little bit sub-optimal. It’s very costly.💰

If you choose using last click, you miss channels that work earlier in the purchase journey, even when they are the best thing for you. The middle pie is data from Analytic Partners – it shows that with last click, you miss out on 35% of possible sales achievable for your budget.

We get it, it’s understandable, last click is sticky.

Perhaps you’ve made decisions using it in the past and it would be a climb down to change them now.

Or, maybe it’s just that the numbers are always there and changing for something else would mean less or slower access to intel.

But it gets the answer wrong.

It’s no wonder the right-hand pie shows 40% of marketers are worried about measurement.

If you’re one of them, and you want a simple run down of why it’s a problem, how to fix the mistakes your business might have made in the past, and what to do instead, you need our course Scaling Up Works.

🚩Sign up by going to the courses page at the top of the screen or chat to Imogen for group bookings and questions via [email protected].


Killer Charts 1

Killer charts are powerful things. Here’s an example of how to make one.

It comes from VCCP and Cadbury’s IPA effectiveness awards Grand Prix winner in 2022, which we at magic numbers helped to author.

It starts off as a humble line chart, showing the change in Cadbury’s penetration over time, but fresh out of Excel, the chart doesn’t really show anything. It looks flat and uninteresting.

But give it a 4️⃣-step makeover, and this pedestrian chart turns into a killer.

1️. Make the change in penetration abundantly clear to the reader by truncating the y-axis – that means chopping off the bottom of it.

It’s fine to do this for line graphs, because the important thing is the change over time, not the height of the points. It’s an absolute no-no to truncate the axis on bar charts.

2️. Annotate the chart to make it even clearer what the reader is supposed to see. The turnaround in penetration coincided with the campaign launch. Great! Write it on the chart!

3️. Take stuff that’s not needed out. In the frame above, there are no grid lines, no axes, and no label on the x-axis. Who needs a label to know that those things are years?

4️. Add stuff in that tells your story. The title is the message, the campaign period is highlighted in colour and impossible to miss.

If you like this sort of thing – presenting and communicating killer charts or guides you can follow to make your marketing data more powerful – then you should check out our Data Works course.

🚩Sign up by going to the courses page at the top of the screen or chat to Imogen for group bookings and questions via [email protected].


TML Podcast

If you’ve got a spare 30 minutes, listen to Dr Grace Kite chat to Omar Oakes on The Media Leader Podcast.

They talked about:

• The magic numbers story, how it grew to become the independent consultancy it is today
• The recent merger with Analytic Partners
• Cannes Lions with the marketing effectiveness tribe
• Misconceptions about econometrics – it’s not a scary black box
• The role of online video and how it’s becoming part of the media plan

🚩It’s a great lunch break or commuting listen. Click here to listen.


Reach over conversions

Want conversions? Choose reach!

It’s strange but true. When choosing your objective for advertising on Meta, choosing reach delivers 50% more incremental sales than spending the same money on a conversions objective.

Choosing a conversion objective doesn’t mean your advertising is going to work better at converting people. It means that the algorithm is going to go and find people who are more likely to convert.

Whether that’s people who like clicking on links, signing up for stuff, or buying whatever it is you’re selling, when you choose conversions as an objective, you’re preaching to the choir.

It’s signposting, or at best a nudge in the right direction, rather than the thing that convinces them to buy.

And that means fewer incremental sales.

If you want to learn more about digital ads as signposts, what incrementality means, and much more, join our course Scaling Up Works. It’s all about how to get the mix of brand and performance right.

🚩Sign up by going to the courses page at the top of the screen or chat to Imogen for group bookings and questions via [email protected].


IPA Shortlist

Three papers on the shortlist supported by magic numbers this year:

Congratulations to Cadbury, Yorkshire Tea, and Muller for being super effective… You don’t get shortlisted for IPA (Institute of Practitioners in Advertising) hashtagEffectivenessAwards unless you’re very good indeed at airing advertising that has a genuine commercial impact.

Here are the shortlisted papers:

• Cadbury, Mondelēz by VCCP: Stop weeping on the sofa, start gifting with a poster: How Cadbury won Christmas
• Müller by VCCP: Out with the new, in with the old: how Müller turned the corner
• Yorkshire Tea, Bettys and Taylors of Harrogate by Lucky Generals and Goodstuff Communications: Long-term brand building done proper

🍀Best of luck to these three and all who’ve worked on them come October and the big awards night, we’ll be there with bells on!


Acquisition

It’s a MASSIVE milestone.

As of this week magic numbers and magic works are no longer just plucky start-ups, we’re now part of a bigger company.

Our new parent is Analytic Partners. They’re a top-quality specialist in econometrics and related number crunching. Based in the US, they work with epic clients like McDonalds and Hilton.

If you know me well, you’ll know I didn’t make this decision lightly… the two types of magic are very precious, and I completely geeked-out finding a good company to team up with.

Here’s the top 3 reasons AP were the right answer:

1. AP put “partners” in their brand name because, like us, they put customers’ people first.
2. They’re committed to top quality, super-reliable analysis. Like us, they’re independent.
3. They’ve invested millions into brilliant tech for always-on decision-making. Now we’ll be able to offer that too.

If you already work with us, you won’t see any change in the day-to-day. Our brand, business, team and business relationships will all go on.

But it is the start of a new stretch of road. The picture is of me with AP’s brilliant founder, Nancy Smith, just one of many new friendships that are blooming.

Data Works testimonial – Luke Tuckey

“I was able to present my thoughts and past results even more clearly – showcasing my work and understanding of marketing results”

Don’t take my word for it, Luke Tuckey (MCIM) has done my course Data Works…

Having confidence in your ability with data, being able to confidently analyse and clearly present it back to stakeholders is paramount if you’re in marketing. Something this course has now given me.

As somebody who was told I was being made redundant later this year from my current role this course helped me personally with interviews as I was able to present my thoughts and past results even more clearly – showcasing my work and understanding of marketing results even more; very helpful when going for senior marketing roles and standing out from the crowd with CMO/CEOs.

The way the course is structured was amazing, working as part of fictional marketing team with everyday scenarios (and typical pushbacks we as marketers encounter). You’ll be able to make killer-charts, understand and present price elasticity of customers (this one hurt my head, thanks Grace), commission econometrics and much much more!

I can fully recommend the Data Works course by the forever insightful Dr Grace Kite and the team at magic numbers.

Data Works testimonial – Albert Recinos

“I especially enjoyed learning how to present data in a clear and engaging manner”

Albert Recinos highlighting one of the key takeaways of my course Data Works. Read more and sign up here: https://lnkd.in/euVXR9zK

I’m excited to share that I’ve recently completed the Data Works training course with Dr. Grace Kite and her team at Magic Works (magic works).

The course was incredibly insightful, teaching me how to use data effectively and how to avoid common pitfalls. I especially enjoyed learning how to present data in a clear and engaging manner.

Grace made the course enjoyable, and the live sessions were invaluable for getting questions answered and learning from fellow students’ experiences.

I’m excited to apply these new skills and present data in ways that drive meaningful action.

Social incrementality

You’ve read that attribution isn’t that reliable.

But what to do instead? You know you want the type of online media that’s going to drive growth. But where to find it?

This chart is from my course for scaling up a business big or small. It shares the secrets that magic numbers analysts and I know from evaluating real trials or marketing done recently by people like you.

The chart shows that social is more likely to drive growth when:

  • It’s got some new-ness. When it finds people who didn’t already know you, and features products you aren’t already famous for.
    • It’s a video. Static ads are easier to scroll past and easier to forget. They remind people who are already thinking of you, but less often change people’s minds
    • It targets video views or reach. If you choose objective clicks, you more often get people clicking who are using your ad as a navigational tool.

The course includes benchmarks like this for paid search, affiliates, display and more. And it includes how to use research to move away from benchmarks and into a view like this for your own business.

The payoff is that you can save money by focussing your online budget on buys that are incremental or signposts that are really needed and not waste a penny.

If you’re in an online business that’s thinking about these issues and the right balance between brand and performance, Scaling Up Works course is for you.

🚩Sign up by going to the courses page at the top of the screen or chat to Imogen for group bookings and questions via [email protected].


Killer chart 2

Bar charts are the bazooka of data communication.

It’s because they’re the easiest way to understand data. The first chart kids get taught at school. But it’s easy to muffle the effect by making them look complicated, even when they’re simple.

Take this one from my 2021 presentation for the IPA. We’re looking at average return on investment from advertising by size of business.

This is a fabulous piece of data. Business size is the most important determinant of advertising ROI, so this chart is one you can refer to forever, to see if your ROI is better or worse than it should be.

But the starting chart is a mess. There’s way too much going on. A lot of “ink on the page” doesn’t add anything to the reader’s comprehension of the central point.

✂️First step is a FIERCE declutter. Remove the background, legend, axis labels and funky bar formatting.

And then add stuff. Put data labels on the bars and write what you want the reader to see in the title and annotation.

Tada! It’s now a killer chart worth a book mark for any marketing professional.

It’s one thing building the killer chart, but communicating it for change is another. Our next intake for our course Data Works and covers all this and more.

It’s all about numbers. What marketing people should do with them, how to do it, and how to make people listen.

🚩Sign up by going to the courses page at the top of the screen or chat to Imogen for group bookings and questions via [email protected].


Cannes presentation hosted by IPA

Tomorrow Dr Grace Kite, Bridget Angear and Tom Firth will be chatting through their Cannes presentation.

They’ll cover some of the new frontiers of effectiveness thinking, including:

  • Advertising as pricing power
    • The effectiveness of humour
    • How planet, people and profit co-exist: managing the ‘triple P’ dashboard

On 16th July, 10-11am BST, it’s hosted by IPA (Institute of Practitioners in Advertising) and is free to sign up via link in comments.

With an opportunity to ask questions at the end of the session, it’s not one to miss!


Inspiring futures podcast

Is effective marketing like playing chess? I think so.

It’s something I explain in a conversation with Edward Cotton Chief Strategy Officer – CMOs and marketing directors should lay down a strategy, and then use measurement to check that it’s working and stay on course.

The conversation also covered:

  • How marketers sometimes stray too far into simply reacting to every bit of data that comes their way
    • The ever-expanding role of retail media
    • The challenges that performance focussed businesses encounter when adopting brand building
    • The importance of story telling with data

Highly recommended if you want to think big picture while staring out the train window, or walking the dog.

And, if you want to learn more about getting the right mix of performance and brand, or data story-telling, check out my two courses at magic works here: https://lnkd.in/eSwNfZvc

🚩Listen here: https://lnkd.in/ebwdjFvA, or for group bookings or questions, drop Imogen Howard a message.


Landing the Long Term

Communicating data well creates change. It really does.

The Long and the Short of It is famous, much quoted, and talked about. But what not many people know is that it actually changed behaviour in a big way.

The chart shows an indicator of short-termism in advertising planning. Up until 2013 when TLATSOI was published short-termism growing fast.

But afterwards, slowly, one advertiser at a time, we changed the planning horizon. The indicator of short-termism had a turning point and began to fall. It’s down a whole 10 percentage points since its 2014 peak!

It’s because of the stonking work done by the authors and publishers Les Binet, Peter Field, and IPA.

📈But it’s also because TLATSOI had a killer chart – the yellow and orange one with steps and spikes – and a killer stat – 60% brand, 40% activation.

A good bit of data, communicated well is powerful. It can absolutely bring change. Good change. Progress.

And you don’t have to be a super hero like Les Binet and Peter Field either. If you want to be able to make killer charts and stats that make change happen in your organisation you can learn on our Data Works course.

It’s all about numbers. What marketing people should do with them, how to do it, and how to make people listen.

🚩Sign up by going to the courses page at the top of the screen or chat to Imogen for group bookings and questions via [email protected].


Cinema admissions

Movie watching is forever changed since COVID.

UK cinema admissions are down by around a third compared to 2019, despite recent big-budget movie releases like Dune, Fall guy, and Mad Max.

Even the final Daniel Craig James Bond film and Barbenheimer underperformed vs. normal pre-covid hits like Star Wars: The Rise of Skywalker.

This isn’t necessarily cause for concern for individual advertisers’ payback from the channel – because cinema ads are generally bought per thousand admissions.

But it is a big loss to advertisers as a whole.

Cinema is great for telling stories, scoring highest in its ability to trigger a positive emotional response (Ebiquity). More than half of regular film-goers are positive about the ads they see vs only one third for TV (old salt).

Part of the problem is streaming.📺

In a cost-of-living crisis, it’s hard to justify spending nearly £40 to go out to watch a film, when, if you wait, you’ll be able to watch it at home on your own sofa, on your own TV, for a fraction of the cost.

And, if you’re a film-maker that has a streaming war to win, it’s very tempting to break the traditional rule of keeping new movies for cinemas only, and use them instead to drive subscriptions.

A lot now rests on experiments like Disney/Pixar’s recent Inside Out 2, which has been reserved for theatres for 100 days. These trials have to pay off if cinema is to win back its exclusivity over new movies, and regain its lost audiences.

If you aren’t sure how important story telling is and tend to lean most on performance marketing, our Scaling Up Works can help. It covers why memorable advertising matters, and how to identify wasted spend in your performance budget that could be released for something richer.

🚩Sign up by going to the courses page at the top of the screen or chat to Imogen for group bookings and questions via [email protected].


Influencers

For a big impact choose a small influencer.

The chart shows that return on investment from influencer marketing is highest where influencers have fewer followers*.

It seems strange, but it actually does make sense.

  • Smaller influencers have fewer, more engaged followers.
  • They talk to a higher proportion of them on a more personal level and even mirror their followers’ language
  • So, each promotional post has a greater effect per follower and per £1 spent

This is a good step towards learning how to use influencers well, something that will be important for anyone wanting to build brands in the platform world.

  • Influencers are well placed to produce the right creative: Tom Roach calls them ‘platform native creators’ uniquely able to match content to the platforms they use.
  • And they’re trusted. In a survey by WARC’s nearly three quarters (74%) said they trust influencers to promote products in the best interest of their followers.
  • At magic numbers we often evaluate influencers in our econometrics and we’ve found them to be effective at driving sales over the long term.

If you’re an online business wanting to use the platforms for brand building, check out our Scaling Up Works course.
It’s all about how to get the mix of performance and brand right and unlock a new phase of growth.

🚩Sign up by going to the courses page at the top of the screen or chat to Imogen for group bookings and questions via [email protected].


Scaling Up Works testimonial – Chris Lock

Well done Chris, aceing it through our course Scaling Up Works! Pleasure to have you as part of the magic works community ☺️

Contact Imogen Howard via [email protected] for group bookings or questions.

I’ve just completed the Scaling Up Works training course from the awesome Dr Grace Kite and team at magic numbers. Here’s my shiny new certificate.

I love to keep up to date with the latest in marketing theory and practice, as well as how best to deliver learning and development experiences. And this course was excellent. Grace is a natural communicator and simplifier. The theory is well-explained, and the practical exercises really hammer home the learning. The live sessions are great for getting questions answered. And the community is highly supportive.

Thoroughly recommend it!


Election: Party CPAs

Don’t vote on Thursday for the party that’s best at advertising, it’s a different skillset to running a country.

But if you wanted to know which of them does our stuff properly… Well, newsflash, it’s the Greens, with a cost per vote in 2019 of only 50p.

And if you wanted to know who was worst, it’s the Lib Dems.

At the last election, any party could have spent up to £19.5m chasing votes if they had candidates in every constituency. The Conservatives, Labour, and Lib Dems did just that.

But, despite spending big, the Lib Dems got less than 4 million votes, only 12% of the vote share.

Paul Dyson always says the bigger you are the better your ROI, and the lower your CPA, so perhaps the Conservatives and Labour benefitted from just being bigger than the Lib Dems to start with.

Or maybe it’s to do with creative.

This time the Lib Dems’ content is catchier. They’re betting on Ed Davey paddleboarding, riding rollercoasters, and racing down waterslides to improve their effectiveness.

At the other end of the scale, the Green Party, spent only £440k but got almost a million votes.

Part of it’s that they didn’t spend enough to get into diminishing returns, but it’s also that they’re double D. With a clear position on environmental sustainability, they’re both distinctive and different to the rest.

💰If you want to know how to improve bang for your buck in your marketing, and be able to convince your organisation to act, you should check out our course Data Works.

It’s got a rundown of things to look for that might be holding you back, and it sets you up to make killer charts and stats, then nestle them in presentations that work to kick off change.

🚩Sign up by going to the courses page at the top of the screen or chat to Imogen for group bookings and questions via [email protected].


Scaling Up Works testimonial – Alice Talotti

🙌Another happy student completing Scaling Up Works – well done Alice Talotti!

The course starts again on 15th October. Link in comments to sign up, or email Imogen Howard via [email protected] for group bookings or questions.

I’m happy to share that I’ve obtained a new certification: Scaling Up Works from magic works!

Finding the right balance between performance and brand marketing can be a challenge – but after completing this 8 week course with Dr Grace Kite and Tashan Nicholas it’s safe to say that there are proven ways to overcome these challenges.

I particularly liked how hands-on the course is. The frameworks and case studies can be applied directly in day-to-day business to optimise current marketing activations and maximise business outcomes. The common language that the course conveys through many data-driven meta and case studies helps to convince key stakeholders. And the exchange with the community in the course is the icing on the cake 🙂


Regional testing

All about geo-testing! If it’s something you’ve heard about but don’t know when to use it or how it works read on…

There are lots of situations where geo-tests work to answer questions about media, but the most powerful are when:

  • You haven’t run a media channel before and you want a low-cost way to see if it works
    • You think a media channel you’ve always spent on doesn’t drive many sales but it feels too risky to switch off completely
    • You want to verify a test result from a media especially if it showed strong results e.g. Google or Meta

They work by breaking the country up into different regions, with one set of regions running the ads the other not.

Let’s say an online business want try out YouTube for the first time. They could split the country up like the map on the left of the image. They run YouTube in the blue areas, and they don’t run it in the pink.

If the campaign lasts for 10 weeks, then we might then end up with something that looks like the chart on the right.

Sales for the two regions match very closely prior to the test, then they increase for the region that has had the YouTube activity, before converging at some point after the test.

The difference between these two lines is the impact that YouTube has had.

Hooray! We have proven that YouTube works and quantified how well it works too.

One watch out: This was a simple explainer, but analysts do have to make a few decisions and judgement calls… so make sure you’re getting your test done by someone with no ulterior motive.


Moneyball media cut down

Moneyball media channels: The latest effectiveness stats reveal they are radio & podcasts, linear TV, and, would you believe it? Print.

⚾The movie Moneyball revolved around a strategy for winning at baseball invented by a guy called Pete Palmer.

He saw that, in choosing the same sort of players as each other, typical baseball managers played it safe, and in doing so, ignored players that would otherwise have helped them win. This opened up an opportunity for a brave manager to do something different and end up top of the league.

It’s a story for marketers as well as sports fans, because a marketing team that can pick media channels that work well but aren’t in demand has a distinct advantage.

The chart above reveals these moneyball media channels using the latest effectiveness stats from Profit Ability 2 by Thinkbox with Ebiquity plc and GroupM

  • It has share of profit amongst the 141 businesses in the study on the x-axis, and share of total spend on the y-axis.
    • Media channels that appear above the 45 degree line are fashionable. We’re spending more on them than we should given how profitable they are.
    • Below the 45 degree line are moneyball channels, the choices that work, but don’t attract their fair share of spend.

In the movie, some of the best picks made by Brad Pitt’s character, Billy Beane, were older players who’d been prematurely benched. And the analysis in the diagram shows the same thing is true for media channels.

It’s radio and podcasts, linear TV, and, for the audiences that still read it, print, that are the moneyball channels of the post-covid era.

Read the full article: https://magicnumbers.co.uk/articles/what-the-latest-effectiveness-stats-reveal-about-moneyball-media-choices/#


TMM Joy speaking

Tomorrow! miss it miss out!:

We love chatting about MMM and attribution. So much so, our Principal Economist Joy Talbot will be on The Marketing Meetup tomorrow, Tuesday 4th June, at 2pm which you can sign up to for free!

Joy will give you the lowdown defining MMM and attribution, exploring the current trends on the both of them. It’ll be packed full of practical, useful tips and tricks all 100% necessary for the modern-day marketer.


Lego

Analytics findings should feel like Lego: Easy to handle, empowering, and usable for building stuff – stuff like revenue, profits and pay-rises.

But too often they don’t…. You get a deck full of 5 syllable words you’ve never heard of and slides that exist to prove the analysts are clever.

You get caveats and warnings about how not to use the findings, and never a straight up, clear, next step.

It doesn’t have to be that way…!

I’ve worked with WARC on a guide for non-technical people that want to commission MMM well and get the most from it. It’s got no jargon in it, but loads and loads of practical tips and help for normal marketing people who just want to do better marketing.

So if you don’t fancy having hierarchical Bayesian multicollinear endogeneity slapped on your desk at the end of your project, check the link: https://magicworks.training/wp-content/uploads/2024/04/Marketing-Mix-Modelling-A-How-To-Guide-for-Marketers-FINAL.pdf


Gu testimonial

It made me grin so much to get this message from the lovely Charlotte Brown from Gu Chocolate Puds.

You don’t expect an econometrics debrief to bring this much joy do you…? We always aim for “more like art on a Friday than maths on a Monday” so it’s lovely to hear it when that’s the way it lands.

Big up to the magic numbers team and Kate Utting too.


Meta search lift tests

Search is driven by other media channels, but your current decision tools might not know that, and as a result, you could be spending too much on paid search ads.

It’s not actually that surprising that other channels affect search.

Searching is a step on the route to finding out more and a part of the journey to the checkout, but it’s not usually the thing that makes you set off on your journey to purchase. There’s usually some earlier reason.

The trouble is that last click attribution – which comes packaged with online media buys – isn’t capable of seeing the earlier reason, and a lot of people have been using last click for a long time.

It’s taught a generation that search is more important than it really is, and made some people frightened to consider switching any of it off.

The result is that many advertisers are heavily over-invested in search ads.
We work with clients and students who join our training to help them use data to redress the balance, because we see, over and over again, that there’s waste.

The diagram shows a multi-stage purchase journey. It’s the kind of situation where Meta’s “search lift” test is useful. It’s a way of testing what your ad on Meta does for search.

It’s a step in the right direction. As is anything that unpicks the true drivers of search and what it really does *and doesn’t do* for your business.

🪧There’s still time to sign up to my course Data Works, the “how to use” guide for marketing data. Sign up by going to the courses page at the top of the screen or chat to Imogen for group bookings and questions via [email protected].

Read the original post here: https://www.linkedin.com/posts/grace-kite_marketing-data-learning-activity-7191338100227231744-CrKw?utm_source=share&utm_medium=member_desktop


Email is the channel that never dies

📨 Email is the steam engine of marketing, it just keeps chugging on

For marketers, email has got a lot going for it: Everyone needs to check their emails, it’s cheap, and it’s not controlled by global tech giants.

But for customers, the prevailing wisdom is that it’s a bit of a pest. Clogging up your inbox with marketing messages when you’re just trying to answer the boss or set up a playdate for the weekend.

But no. Surprising as it seems, the data shows click and open rates for marketing emails haven’t wavered* since 2005. For nearly 20 years, a solid 30% of recipients open emails, and 3% click through to the website.

Now, obviously, email has its limitations. It’s never going to be a channel to hang a huge brand-building marketing campaign on, and you can only email people who gave you their email address.

But it’s also an example of something that, for marketers, is old but still gold. The best thing to do isn’t always the newest and the shiniest, and it’s only with data that you can find the right mix.

It’s why we think alumni from our data works course will be even better marketers than before.

🚩Sign up by going to the courses page at the top of the screen or chat to Imogen for group bookings and questions via [email protected].

Find the original post here: https://www.linkedin.com/posts/grace-kite_marketing-data-learning-activity-7189187237027196928-PHqU/?utm_source=share&utm_medium=member_desktop

* Data was combed from the web by Rand Fishkin of SparkToro


Data Works Starts Today!

Making data doable, tada!

Even though Data Works starts today, it’s not too late to join.

For those that are already onboarded, hooray! We’re excited to dive into all things killer charts and stats, and how to not be bamboozled by data.

🚩Follow this link: https://www.linkedin.com/posts/grace-kite_marketing-data-learning-activity-7188473175817560066-hvlI?utm_source=share&utm_medium=member_desktop to sign up today, or contact Imogen Howard via [email protected]

🪧If you’re interested in analytics or consultancy, drop me a message.


That’s What I Call Marketing Podcast

Here’s a snippet of my conversation with Conor Byrne on That’s What I Call Marketing Podcast Podcast.

Key takeaways from the conversation:

– 65% of marketers are still using last click attribution in their evaluation
– Niche influencers can be powerful💪
– Die hard is a Christmas movie

And so much more. Listen today via: https://www.youtube.com/watch?v=6uNXE6wBk3Y&feature=youtu.be

🪧Want to be a pro with numbers and use them to get action? My course Data Works starts this week week on 23rd April. There’s still time to sign up in our induction week, follow https://magicworks.training/course/data-works/ to book now.
If you have any questions or for group bookings email Imogen Howard via [email protected].

If you’re interested in analytics and econometrics in marketing, drop me a message.


Ask GR(AI)CE

Got an effectiveness question? Ask GR(AI)CE!🤖

It gives some pretty helpful answers on marketing topics I’ve researched and talked about. However, like most AI language learners, it sometimes comes out with absolute rubbish.

We don’t think it’s quite ready to take over from me full time, but give it a try and let us know if you think its answer is buggy! Give it a go here: https://lnkd.in/eMbZcEEZ

Alternatively, for those that want to learn about marketing measurement from a human, I have the perfect thing for you!

My course Data Works will tell you how to use data to your advantage rather than being ruled by bots and dodgy algorithms, and how to spot a shonky chart a mile away. And, you can ask me questions each week that I’ll answer instead of relying on GR(AI)CE.

🚩Sign up by going to the courses page at the top of the screen or chat to Imogen for group bookings and questions via [email protected].

Read the original post here: https://www.linkedin.com/posts/grace-kite_marketing-data-learning-activity-7186649712836456448-zBiL/?utm_source=share&utm_medium=member_desktop


Onboarding starts next week

Onboarding starts next week!

I put a lot of love into the Data Works course, sweated over making it practical and useful and just brilliant for anyone who needs to be more of a whizz with marketing data.

If you’ve been thinking about it, but not got round to onboarding, now’s the time. Follow this sign up link! https://learn.magicworks.training/landing/plans/366609?uat=MaBXQ9ZZymBJxj5_


Marathon measurement

🏃‍♀️Measuring something changes the outcome.

That’s what this chart of the distribution of marathon times tells us.

4 hours is the milestone time to beat for many runners, and you can see it in the data.

Because so many runners really bust a gut to make it over the finish line before the 4-hour mark, we see that 3’58” & 3’59” are the most common times, after which there’s a huge drop-off.

Early in the 5th hour there’s no real incentive to push.

Measurement changes behaviour in marketing too:

  • Pre-testing doesn’t always predict ad performance. Because people know they are being watched in the test, but not in the real world.
    • Same story with survey data. People don’t say what they do.
    • And just because someone “likes” something, it doesn’t mean they’ll buy it.

If you want to be wise to this and a whizz with data, have a look at my Data Works course – link in comments – it’s for anyone that works in marketing but hasn’t had training on marketing data.

🚩Sign up by going to the courses page at the top of the screen or chat to Imogen for group bookings and questions via [email protected].

Read the original post here! https://www.linkedin.com/posts/grace-kite_measuring-something-changes-the-outcome-activity-7185924967354486784-zf6F?utm_source=share&utm_medium=member_desktop


Cookie apocalypse shut down

🌠The sun will turn black like sackcloth and the stars will fall from heaven onto earth. Yes, it’s the end of days for 3rd party cookies.

While the fallout of the cookie apocalypse won’t come anywhere near to these forbidding images from Book of Revelation, the loss of cookies is bad and it comes at a bad time.

Right now, 65% of marketing departments rely on last click attribution to decide on media to buy even though it’s acknowledged to be unreliable.

The loss of cookies removes a route for fixing that, and it forces already busy marketers to adapt, innovate, and implement new things.

The chart shows the scale of this problem. In pink is the loss of sales that could have benefitted advertisers due to using last click attribution. £74bn of sales are lost per year across the UK & US every single year.

It’s more than the GPD of Slovenia, and a lot more than the UK defence budget. And we all know how much Chelsea have spent on new players since Todd Boehly took over right? Well, this loss could buy those new players 70 times over.

So where should marketers turn to in these tumultuous times? It would be a mistake to insist on filling that hole with something that looks and feels the same as attribution. Instead, lots of marketers are turning to Econometrics/MMM.

Econometrics/MMM looks and feels different to MTA or last-click and requires a new way of doing things, but it offers up the opportunity to bring all different types of media into your measurement framework.

This means new and better things, from influencers through to the good old fashioned telly ad.

Read more in my latest article: https://magicnumbers.co.uk/articles/the-great-day-of-3rd-party-cookie-anger-has-come-and-who-can-stand-upright/#

💡 And if you’re interested in learning more about how not to be misled by poor measurement, check out my course Data Works via https://magicworks.training/course/data-works/.

Contact Imogen Howard via [email protected] for more info.

Go back to the original post here: https://www.linkedin.com/posts/grace-kite_the-sun-will-turn-black-like-sackcloth-activity-7185540681472319488-28YG?utm_source=share&utm_medium=member_desktop


YouTube CTV

Want to hack brand building? Online video is your low-cost route onto the TV set.📺

The story usually goes that the rise of streaming has been a nightmare for advertising, because our TV sets have been invaded by high quality content that doesn’t get interrupted by ads. Brilliant for consumers, but a disaster for brand building.

But now something else has happened.

YouTube has arrived on the telly, stealing share from Broadcaster TV. YouTube now represents 4.8% of all viewing on the TV set, and 9.4% for 16-34 year olds.

These are ad-funded video services coming to the living room on the big screen with the default sound on. They bring a compelling short format that people like, and unlimited searchable content. Brilliant for consumers, and brilliant for brand building too.

And online video works for brand building. It has high return on investment, and long-lived effects. It must be true, 3 separate sets of research using meta analysis of econometrics found the same thing:

  • Analytic Partners found online video has better short-term and long-term ROI than TV, and all video’s lasting impact is twice as long as non-video
  • Mediacom/Wavemaker/Gain Theory found that online video has the same brand building effect as Print, OOH and BVOD, and comes with immediate data on how it’s working
  • Meta found that online video drives almost as many sales as TV, with the best bang for buck of any channel

So, if you sell online, and you want to get the balance of brand and performance right, you don’t have to convince your bosses that an expensive TV creative and broadcast telly is the way forward.

Hopefully, you’ve learned something interesting here about balancing brand and performance marketing, but what drew you in? If it was the killer chart, or stat, or you want to learn more from the “how to” guide for marketing data you should check out my course Data Works.

🚩Sign up by going to the courses page at the top of the screen or chat to Imogen for group bookings and questions via [email protected].

Read the original post here! https://www.linkedin.com/posts/grace-kite_marketing-data-marketingeffectiveness-activity-7184113045550342144-H8Z-?utm_source=share&utm_medium=member_desktop


Inside Marketing Podcast

In the Irish Times’ Inside Marketing Podcast episode I had an ace time chatting to Dave Winterlich.

We delved into:

  • The concept of ideas as a bullet, with data as the gun. Data is the thing that gets your ideas acted on, especially when you need to get the CFO on board.
    • Misconceptions about marketing data and mistakes people often make. For example, rely too much on attribution and you risk overlooking advertising options that really work.
    • All about our Data Works course which is for anyone that works in marketing but hasn’t had training on using marketing data well

You can listen to it here: https://www.irishtimes.com/sponsored/2024/03/22/more-than-just-a-numbers-game/


YouTube Online Nation

Did you know YouTube has the highest reach of any ad-carrying platform in the UK?

Equal to Facebook & Messenger combined. And more than Google search.

🤯Surprising right?

Surely ‘googling’ is something that absolutely everyone does. It’s been in the Oxford English dictionary since 2006 after all!

But no, nowadays everyone’s on YouTube.

Your mum. Your grandad. Your kids especially. That’s where YouTube has the strongest hold, reaching 96% of children aged 8-12, and suggesting this trend will continue long into the future.

It’s an interesting one for advertisers, because we know that online video is a unique channel capable of brand building, with stronger long and short-term ROIs than just about any other channel. If you don’t believe it stay tuned, I’ll be posting the evidence shortly.

You can get started with smallish budgets, and apply test and learn strategies, with the immediate data you get back from the platforms – particularly useful if you sell online.

But how do you know it’s done well? My course Data Works is the “how to guide” for marketing data and will tell you all you need to know on measurement and how to communicate it for change.

🚩Sign up by going to the courses page at the top of the screen or chat to Imogen for group bookings and questions via [email protected].

Read the original post here! https://www.linkedin.com/posts/grace-kite_marketing-data-marketingeffectiveness-activity-7183388178014179328-x_g6?utm_source=share&utm_medium=member_desktop


Marketers lack training

The marketing industry lacks data and analytics skills above all others, according to Marketing Week’s recent survey of over 3,000 brand-side marketers.

This is a 2.5 percentage point increase on the number from 2023’s survey, in which data analytics was already firmly in first place.

The gap hasn’t been addressed.

Until now.

Marketing industry, I have just the thing for you.

My Data Works course is a “how-to” guide for marketing data. It sets out what marketing people should do with numbers, how to do it, and how to make people listen.

🚩Sign up by going to the courses page at the top of the screen or chat to Imogen for group bookings and questions via [email protected].

Follow this link to read the original post: https://www.linkedin.com/posts/grace-kite_the-marketing-industry-lacks-data-and-analytics-activity-7181576338112151553-w_FL/?utm_source=share&utm_medium=member_desktop


4Ps of marketing

Give the 4Ps a chance? Clever headline* but I bet you’re sitting there thinking “my job’s just advertising and I’m busy enough, thanks”

I get it, but the truth is, the other 3 Ps – price, product and place – still matter🤝

Because if they aren’t all sorted, they undermine the effectiveness of advertising. And when they’re working really well, they can multiply the effects 10-fold.

It’s because advertising is a weak force, not a strong force. It isn’t capable of persuading people to buy on its own.

People just aren’t that easy to convince. To give a silly example, no advert can convince someone to buy dog food if their pet is a cat, and the principle is true even in less silly situations. There’s a huge set of academic studies that confirm it, many of them by Andrew Ehrenberg.

So even though you, in the marketing department, might not have power over the other 3 Ps, you need to understand them, and design your advertising plan accordingly.

Don’t air in the region where you’re not stocked in all the shops, and hold off spending until the product team fixes the font size on the labelling.

And bet your big budget when the price relative to competitors is just right.

My Data Works course teaches you how to use data and the framework of the 4 P’s to understand the lay of the land that your business is operating in and design your plan accordingly.

🚩Sign up by going to the courses page at the top of the screen or chat to Imogen for group bookings and questions via [email protected].

Go  back to the post here: https://www.linkedin.com/posts/grace-kite_marketing-effectiveness-learning-activity-7180866719349911552-c62g?utm_source=share&utm_medium=member_desktop


Easter shrinkflation

Easter Eggs. They don’t make ‘em like they used to.

🥚It isn’t just that your hands have got bigger from when you were a kid, many eggs are smaller than they were, and they haven’t got any cheaper to make up for it either.

But there is one brand amongst the pack that’s bucking the shrinkflation trend. Where Mars, Kit Kat, and Minstrel eggs are smaller, Crème Eggs have actually got bigger!

They’re 15% bigger than they were at launch in the 1970s. And, even though they launched at 7p and now cost 75p, that price rise over the course of 50 years isn’t too much. It’s broadly in line with inflation.

Thanks Cadbury! Very generous of you.

Generous to all the kids and all their sticky fingers come Sunday. But also completely in line with the brand’s values and a demonstration of them living their positioning in how they act, not just how they talk.

Cadbury’s IPA Grand Prix winning advertising was all about generosity. The paper said it wasn’t just a pretend purpose, but something the brand really lives and breathes. This proves it true again!

Marketers take note. You’ve got to understand how all elements of the product, place & price are working for your brand, before you can get promotion (i.e. advertising) firing on all cylinders and working well.

Learn more in our Data Works course which teaches you how to use data and the framework of the 4 P’s to ensure that everything is working together for the biggest return on your marketing investments.

🚩Sign up by going to the courses page at the top of the screen or chat to Imogen for group bookings and questions via [email protected].


CFOs and uncertain times

Putting prices up is how 63% of CFOs prefer to manage uncertain times.

That’s what McKinsey found out in their Global CFO Survey last year.

And if every brand could put their prices up without taking a huge hit to volume sales, they surely all would. The CFOs of the world would be very happy.

It’s of course not quite as simple as that.🤯

We’re living in a world where inflation is slowly coming down, but remains relatively high – as high as 5% in food and drink according to the latest data released week.

So things definitely aren’t getting any cheaper. And shoppers are taking evasive action.

  • People have been switching to own label. Sales of cheapest own-label products were up 47% last year
    • Twice as many people were trying new retailers in 2023 v those in 2021. Aldi and Lidl are the biggest beneficiaries of this, with their combined market share now up to 16%
    • And more people have been comparing online, according to Google searches

In this competitive environment, brands will have to work extra hard to justify their place in people’s baskets, especially if they’re putting prices up.

To find out whether a profitable price rise is going to be possible for your brand, you might need some help from one of marketing’s killer stats: Price elasticity, which describes how much sales volume you can expect to lose from a given price rise.

It’s very useful when deciding whether it’s going to be profitable or not.

My course Data Works will show you how to estimate your price elasticity, as well as some other really useful things to do with data, like getting the lay of the land using the classic 4 P’s of marketing and creating killer charts and stats that make change happen in your organisation.

🚩Sign up by going to the courses page at the top of the screen or chat to Imogen for group bookings and questions via [email protected].

Go back to the original post here: https://www.linkedin.com/posts/grace-kite_putting-prices-up-is-how-63-of-cfos-prefer-activity-7178329920463351808-z1uf


Google MMM Meridian

Google’s MMM comes with bells and whistles, but not enough warnings.

MMM is hot right now. It’s because Google and Apple pulled the rug from under a competing method for evaluating online ads – multi-touch attribution – by removing 3rd party cookies.

Google’s MMM software – Meridian – has some cool add-ons compared to Meta’s Roybn:

  • It can constrain outcomes to be in line with prior knowledge plus or minus a bit
  • It’s granular including using smaller geographies like cities
  • It incorporates data on reach and frequency for YouTube that’s not available anywhere else

Sounds clever.

The problem is that whatever modelling software you use, with MMM there are infinitely many models that will fit the data. There is no algorithm that can reliably choose which one really reflects the outside world.

Skilled and experienced modellers are needed to judge which combination of variables to collect and put in the model to accurately reflect the way that business and its marketing works.

With a lot of data science, running an algorithm is enough to get a reliable answer, but MMM isn’t like that. Throwing things at the wall, and seeing what sticks, just leads to findings that no-one believes.

The other missing warning is that Google is a media owner. One that, as customers, we trust with our searching and our email and our data, but still, a media owner with a product to sell.

It’s not surprising that Meridian offers detail on how YouTube works via reach and frequency curves, but doesn’t roll out the same red carpet for other online video that might work better for you. The emphasis is very much where Google wants it to be.

My advice is to only use it if you’re already experienced with MMM and you’re sure the bells and whistles are worth the compromise that comes from using software built by a company with a vested interest in the outcomes of your evaluation.

If you want to be wise to this and a whizz with data, have a look at our Data Works course it’s for anyone that works in marketing but hasn’t had training on marketing data.

🚩Sign up by going to the courses page at the top of the screen or chat to Imogen for group bookings and questions via [email protected].

Go back to the post here! https://www.linkedin.com/posts/grace-kite_googles-mmm-comes-with-bells-and-whistles-activity-7176517929931288576-vXtc?utm_source=share&utm_medium=member_desktop


Dashboard Confusion

🚨Display has a data problem.

All those annoying ads that turn up AFTER you’ve already bought something – they’re because of an issue with data.

It’s not too little data. Programmatic display uses oodles of numbers to target people who look like they might buy something soon.

Nope. It’s an issue of interpretation.

Somewhere, some person, or, more likely, some algorithm, sees that people who get one of these ads are likely also people that buy one of these things.

But it isn’t because the ad causes the sale.

No, it’s that the ad targeted people who were going to buy anyway. And in many cases people who have already bought the blooming thing…. the example in the picture is in a lovely calming autumn palette, but it was still sort of annoying to me.

This is just one case of marketing people being misled by something that data people called “spurious correlation”.

It’s when two things – like an ad and some sales – are related, but the causality isn’t what you think.

If you want to be wise to this and a whizz with data, have a look at my Data Works course, it’s for anyone that works in marketing but hasn’t had training on marketing data.

🚩Sign up by going to the courses page at the top of the screen or chat to Imogen for group bookings and questions via [email protected].

Go back to the post via: https://www.linkedin.com/posts/grace-kite_display-has-a-data-problem-all-those-activity-7175793192389242880-DrRS?utm_source=share&utm_medium=member_desktop


MDM Erick Seufert Podcast

Just because you’ve got a multi touch shaped hole in your life doesn’t mean you have to fill it with something multi-touch attribution shaped.

In fact, the advice from performance marketing legend Eric Seufert and me is that you may well be better off with a smart and experienced analyst using simple tools to reason around the data gaps than a new black box working off degraded signals.

Complete with memes, analogies, and missing each other in a small corner of London as students, this podcast is well worth a little chunk of your weekend time.

I’ve boiled down a lot of what I know from working with online scale ups handling the challenges of measurement to grow into my Scaling Up Works course. Your last day to sign up is next Monday 18th March.

Listen to the podcast here: https://mobiledevmemo.com/podcast-econometric-advertising-measurement-with-grace-kite/


Marketers needs more data training

Fewer than 1 in 4 UK marketers have any formal training. That’s the lowest proportion in the group in my chart.

And this isn’t just from one source. A recent survey covering 400 marketers across the world saw 66% agree that “the shortage of key skills is proving a major blocker towards growth.”

😱Can you imagine if only 1 in 4 lawyers had any training in the law?

Or if a shortage of legal skills meant innocent people were sent to prison?

That’s exactly the state of UK marketing. And it’s holding us back. We at magic works carried out interviews with marketing people last year and we heard story after story where people struggle.

Sometimes they know the right thing to do, but aren’t confident enough. Other times, the problem isn’t confidence its credibility. They aren’t able to talk convincingly and decision makers with the budget don’t listen or act.

There’s no excuse for it. Since COVID and the move to online training, any business can spend a grand or two and buy knowledge and skills that’ll be multiplier on every marketing initiative.

We haven’t done the study yet, but we reckon training might be the highest ROI thing you can buy with your marketing budget.

If your need is for the theory and the confidence to act on it, Mark Ritson’s mini MBAs are a slam dunk. They’re the equivalent of going to law school albeit a lot more fun.

But if your need is to be more credible and convincing, our magic works courses will be right for you. They’re the equivalent of learning case law because they’re packed with evidence of what’s worked for other businesses.

We’ve got one course on the right mix of brand vs. performance marketing for online businesses, and another all about how to use marketing data if you want to make good change happen.

🚩Sign up by going to the courses page at the top of the screen or chat to Imogen for group bookings and questions via [email protected].

Go back to the original post here: https://www.linkedin.com/posts/grace-kite_fewer-than-1-in-4-uk-marketers-have-any-formal-activity-7173619087263166464-Mh6x?utm_source=share&utm_medium=member_desktop


Course starts, sign up now!

Avoid the FOMO!

Even though today is the day that onboarding for Scaling Up Works starts, it’s not too late to join. Final day to sign up is 18th March.

For those that are already onboarded, hooray! I’m excited to dive into balancing brand and performance marketing with you and to see you gaining practical skills from the modules and homework.

🚩Sign up today via https://magicworks.training/course/data-works/, or contact Imogen Howard via [email protected]

Tanks on Google’s Lawn

🪖Tanks on Google’s lawn!

The most valuable real estate on the internet is the place that people go when they’re shopping. Just like the high street used to be in the olden days.

But the location is changing. The chart shows that over time, people are increasingly going to social media rather than search engines to find their information and the product they’ll purchase.

Perhaps it’s because younger people are wise to all the ways that search rankings and product reviews can be gamed, and they trust their social contacts more. Or perhaps it’s because TikTok is just so damn entertaining.

Either way, most businesses that sell online will need to take a serious look at the real estate they are renting.

Unfortunately, performance marketing decision tools are not going to be able to help with tackling this one. It’s because they look at each channel in isolation, and aren’t good at comparing search vs social or any other 2 channels in the mix. Google’s dashboards are never going to come up with a recommendation to buy more social, are they?

Our course tackles this issue in detail and shows you how to manage it, with methods for every size of research budget. If you’re in need of a hands-on practical way to actually action issues like this, we’d love to see you there.

🚩Sign up by going to the courses page at the top of the screen or chat to Imogen for group bookings and questions via [email protected].

You can also read my article all about online real-estate here: https://magicnumbers.co.uk/articles/the-two-tasks-for-online-ads/

Go  back to the post via https://www.linkedin.com/posts/grace-kite_tanks-on-googles-lawn-the-most-valuable-activity-7172931811981914112-ZQRP?utm_source=share&utm_medium=member_desktop


Ways of Working

It’s not women that need fixing, it’s how the workplace treats parents.

This time last year I wrote an article summarising what economists know about gender pay gaps. The data was and is crystal clear: women get paid less after they have kids, but men’s careers carry on untouched.

The chart below is for the UK (in grey) and the US (in black), but the same pattern shows up in lots of other countries worldwide too.

The analysis confirms 2 things… first there’s no difference in how good women and men are at working. They are valued equally right up until that moment.

And second, to get equality we need to tackle the workplace. We need to make it easier for both sets of parents – men and women – to balance childcare with working.

So why am I sharing it again? Because the gap still very much exists.

There have been some improvements. Flexible working really helps parents. New regulations from April allow you to request it and make it harder for the boss to say no. And there’s going to be an increase in government support for childcare.

These are steps in the right direction, but not enough. Flexible working is still not the norm, and it remains to be seen how many hours of increased childcare support are actually available to parents.

In the meantime, societies around the world continue to expect women to be the ones that do the parenting, and businesses around the world continue to set workplaces up so careers and childcare don’t mix.

If you want to be well informed, the article I wrote last year covers the research done by labour economists on this topic. Read it here: https://magicnumbers.co.uk/articles/its-not-women-that-need-fixing-its-how-the-workplace-treats-parents/#

Go back to the post here: https://www.linkedin.com/posts/grace-kite_its-not-women-that-need-fixing-its-how-activity-7171807175084859394-TL-r?utm_source=share&utm_medium=member_desktop


People stop searching

What if people stopped searching your category?

It happens. And when it does, all of the performance marketing tools that previously seemed to control your sales disappear.

It feels like there ought to be something you can do, but there isn’t.

🛏️The chart is a case study of mattresses during COVID-19:

  • The bars are an index for the number of searches in the UK. Pre-covid, there was a normal amount of demand where the dashed blue line is
  • Then when the pandemic hit there was a short-lived dip in searches during the panic weeks followed by a surge in searches as people stuck at home saved on going out & invested into a comfy home
  • After, in 2021, people were going out again. They had other things to do with the cash, and many now owned a fresh mattress. The number of searches was a lot lower.

When demand is high, like for mattresses during lockdown, it looks like online marketing is really working.

✔️Cost per acquisition goes down. Cost per click falls. ROAS, conversion rates and click through rates all go up.

When demand is low, like mattresses after COVID, all the indicators move in the wrong direction. Marketing suddenly looks ineffective.

But the marketing tools haven’t changed. It’s just that they have no demand to work with, and search marketing can’t generate demand. It can only harvest it.

The story in the chart was the end for more than one online furniture business. And ructions in the economy aren’t over yet. As the UK emerges from the technical recession in the second half of 2023, some sectors will still have a bad 2024.

In my Scaling Up Works course you can learn more about this and other modern case studies. You’ll see how to balance brand and performance marketing and get practical advice on how to manage when the outside world changes.

🚩Sign up by going to the courses page at the top of the screen or chat to Imogen for group bookings and questions via [email protected].

Go back to the post here https://www.linkedin.com/posts/grace-kite_what-if-people-stopped-searching-your-category-activity-7171459267781214208-JYHj?utm_source=share&utm_medium=member_desktop


Should I take SUW pie?

Our course Scaling Up Works is for you if you buy online ads…
Modules 1 and 2 show you how not to be misled by attribution that comes packaged with your buy, what measurement to do instead, and how to save some money by removing waste. Tom Lucas who did the pilot said “We’re smashing through myths and fallacies at breakneck speed”

Or if you’re a brand-curious performance marketer…
Pedro Davó Cabrera said: “I can recommend it to the entire performance marketing community. If you need to grow, facebook and google ads are stagnating, and you need to start creating brand awareness systematically, this course is for you.”

Or if you know awareness building is the right thing, but struggle to convince people…
It’s got data, frameworks, and free tools (like share of search and our online budget planner) as well as tips on how to use them to convince others. Simon S. said “It’s about how to set your business up for success – allocating spends, diagnosing challenges and more importantly: how to get the buy in.”

🚩Sign up by going to the courses page at the top of the screen or chat to Imogen for group bookings and questions via [email protected].

The Marketing Meet Up

Come hear me and Tom Roach chat with Joe Glover! It’ll be nerdy and cover marketing effectiveness in the modern world – and its completely free.

Watch back the event here: https://themarketingmeetup.com/events/a-nerdy-conversation-about-marketing/


Killer charts – building bar charts

📊Bar charts are the bazooka of data communication.

It’s because they’re the easiest way to understand data. The first chart kids get taught at school. But it’s easy to muffle the effect by making them look complicated, even when they’re simple.

Take this one from my 2021 presentation at IPA EffWorks. We’re looking at average return on investment from advertising by size of business.

😍This is a fabulous piece of data. Business size is the most important determinant of advertising ROI, so this chart is one you can refer to forever, to see if your ROI is better or worse than it should be.

But the starting chart is a mess. There’s way too much going on. A lot of “ink on the page” doesn’t add anything to the reader’s comprehension of the central point.

✂️First step is a FIERCE declutter. Remove the background, legend, axis labels and funky bar formatting.

And then add stuff. Put data labels on the bars and write what you want the reader to see in the title and annotation.

Tada! It’s now a killer chart worth a book mark for any marketing professional.

🚩Sign up to our course Data Works where you can learn more about this by going to the courses page at the top of the screen or chat to Imogen for group bookings and questions via [email protected].


Little numbers game

If you still use attribution to decide how to allocate budget across channels… make 2024 the year you stop it.

It’s understandable if you do, and you wouldn’t be alone. Because once you start using it, it’s sticky.

  • You’ve made decisions using it in the past, and it would be a climb-down to change them now.
    • And then perhaps the figures just look good, like you’re performing really well, and your boss has got used to seeing them.
    • Or maybe it’s just that the numbers are always there, and changing for something else would mean less or slower access to intel.

🤯The trouble is though, unless you are a very small and simple business, attribution isn’t good enough. The chart – by D2D and Les Binet from Adam and Eve – shows how far out it is for bigger businesses of the type that buy econometrics.

Attribution reports only half the full return on investment of brand building media channels like TV, but double the return on investment for performance marketing channels.

It isn’t easy to make the change. There will be resistance in your organisation. But it is possible.

🧪There are concrete tests you can do to find waste in your performance marketing budget and trim it. And there are good first steps that make moving into brand building safer and simpler.

My Scaling Up Works course, is hands on, practical marketing training to help you through this journey.

🚩Sign up by going to the courses page at the top of the screen or chat to Imogen for group bookings and questions via [email protected].


SUW Live Q&A March 1st

If you’re thinking of joining my Scaling Up Works course, please join a short live Q&A here on LinkedIn next Friday 1st March at 1pm for 30 mins.

I’ll be answering your questions with Tashan Nicholas the course host and mentor.

If you’re not thinking of joining, you should! This is a “miss it miss out” situation!

You can also watch it back here: https://www.linkedin.com/events/scalingupworksliveq-a7165393356984954881/theater/


Data overload

Too much too muddled. That’s the verdict on marketing data from a 2023 survey.

80% of marketing people said they have too much data, and 40% said their marketing teams and analysts struggle to build a shared understanding of what it all means.

It’s not anyone’s fault. From platforms to websites to ad vendors, people set up systems and produce data that’s designed to help. The trouble is they’re all doing it separately and they go at it in different ways.

It’s no wonder the respondents answered the way they did:

  • The list of metrics is ever-growing: traffic, views, watch time, % viewed, % completed, impressions, reach, engagement, likes, comments, frequency, shares, clicks, and there’s new ones all the time – for example Amazon’s “new to brand”
  • Even when metrics are labelled the same, they mean different things. A video view on Facebook, means a 3 second play, whereas its 2 seconds on X (twitter) and Snapchat, and 30 seconds on YouTube.
  • Attributed sales – which seems like the holy grail, the number of sales you get from doing advertising – is based on a method that ignores everything that happens offline. That’s a lot of life to ignore.

😵‍💫The muddles are real, and they exist in the data itself.

But too often, marketing people and data scientists blame themselves or each other. In the survey, when asked to identify their biggest challenge, 42% said their data scientists didn’t understand marketing, and 38% said their marketing people don’t understand data.

You can avoid the conflicts and misunderstandings by learning the tricks and pitfalls that come with marketing data. And by helping your teams to develop a shared language.

My Data Works course is a “how-to” guide for marketing data. It sets out what marketing people should do with numbers, how to do it, and how to make people listen.

🚩Sign up by going to the courses page at the top of the screen or chat to Imogen for group bookings and questions via [email protected].

Go back to the post here: https://www.linkedin.com/posts/grace-kite_too-much-too-muddled-thats-the-verdict-activity-7166348430888407041-AcTu?utm_source=share&utm_medium=member_desktop


Long term multipliers

🐠There’s no point having a high-tech fishing net if you haven’t got a big pool full of fish.

But this is not a post about Fly Fishing by J R Hartley*. It’s about getting your marketing mix straight. Because performance marketing is the high-tech net, and brand building is what gets you a great big pool of fish.

Any advertising strategy that can help you reach a bigger audience and stay in their mind until they’re ready to buy from your category is building demand for your product now and in the future. That’s giving your performance marketing more of a chance to hook a new prospect and turn them into a customer.

📈The chart shows research on which channels are best for making your pool of demand bigger and fuller of prospects. It’s from a study of the long-term impact of 504 media campaigns. TV comes out top with online video and out of home next.

But perhaps you already know this, and your real struggle is getting the buy-in required from upstairs to take your first steps into brand building.

Maybe a publicly available general chart simply isn’t enough, and what you really need is help turning the theory into something bespoke for your own business. Something that will convince people whose job title starts with “C-“.

Either way, my Scaling Up Works course can help. You’ll learn how to get the mix of brand and performance right; how to write an actionable plan for successful and low risk brand building, and how to influence the decision makers in your business to get the change you want to see.

🚩Sign up by going to the courses page at the top of the screen or chat to Imogen for group bookings and questions via [email protected].

*And if you don’t remember the classic Fly Fishing ad, check out https://www.thedrum.com/news/2022/06/14/world-s-best-ads-ever-96-jr-hartley-gets-people-using-the-yellow-pages-non

Go back to the post here: https://www.linkedin.com/posts/grace-kite_theres-no-point-having-a-high-tech-fishing-activity-7165623623666356224-bDtl?utm_source=share&utm_medium=member_desktop


Speak the language of the boardroom

💼Your boss’ boss’ boss is a city analyst.

And right now, he or she probably rates brand & marketing as a very important driver of your company’s success.

To city analysts, marketing and brands are more important than leadership quality, and, sadly, a lot more important than sustainability too.

When asked why, they say it’s because raising prices is a key strategy in uncertain times, and brands are mission critical to being able to do that without losing all your customers. The last few inflation-ridden months have proved it beyond doubt.

👍It’s great news for marketing people that have to make the case for their budgets. There is an ally in the city that believes in the mission.

The trouble is, there’s a missing link. Marketing departments and city analysts are aligned, but in between them are CEOs and boards who remain sceptical.

Faced with a balance sheet that can only recognise marketing as a cost, and with profit targets to meet, they struggle to make long term decisions around marketing, to view it as an investment.

💯Those businesses that do successfully navigate the challenges do it by using data in a convincing, compelling, and credible way.

Training can help. magic works is running two courses that are designed to help marketers use data to communicate with decision-makers in a way that’s convincing.

🚩Sign up by going to the courses page at the top of the screen or chat to Imogen for group bookings and questions via [email protected].

If you need deeper support via analytics or consultancy, drop me a message.

Go back to the post here: https://www.linkedin.com/posts/grace-kite_your-boss-boss-boss-is-a-city-analyst-activity-7163811706731757568-Yhop?utm_source=share&utm_medium=member_desktop


The idea is the bullet, data is the gun

🤖Automated creativity works. AI ads outperform human ones.

But there’s a dystopia on the horizon. Not one where Skynet nuke’s the planet, but one where creativity eats itself into a boring sludge.

The chart shows brand health scores for car ads generated by AI in blue vs. people in pink. It shows that, given a set of good human ads from the past to learn from, AI ads deliver a higher brand health score, and a higher probability that you won’t air a dud.

Rationally, in the face of evidence like this, we should all switch to letting machines do our creative work. But where will it end if we do?

One possibility is that if everyone moves to AIs which are creating ads based on the same past set of good ones, all new ads will start to look the same.

The next step could be AIs that learn from each other’s past regurgitations of the original set of ideas.

🥱In a world with new ideas, potential customers will get bored, and it will all stop working.

AI may yet develop ways to avoid this awful outcome, but if not, the moral of this story is that data shouldn’t be used to dictate, instruct, or generate ideas. That job should be reserved for people.

Instead, data should be used to convert ideas into action. To demonstrate why that idea is widely relevant, to show what it can do, and to get people to act on it.

🦸‍♀️That’s the super power of good data, and advertising needs it now more than ever.

Read more in my article here: https://magicnumbers.co.uk/articles/the-idea-is-the-bullet-data-is-the-gun/

And if you’re interested in learning more about how to use data in marketing, check out our course Data Works.

🚩Sign up by going to the courses page at the top of the screen or chat to Imogen for group bookings and questions via [email protected].

Go back to the post here: https://www.linkedin.com/posts/grace-kite_automated-creativity-works-ai-ads-outperform-activity-7163086911966797824-BSeh?utm_source=share&utm_medium=member_desktop


The Sleeping Barber Podcast

🎙️Really enjoyed being a returning guest on ace The Sleeping Barber Podcast episode! We discussed all things upskilling your marketing team, including how to close the gap between knowing the right thing to do and actually doing. It isn’t just knowledge you need, it’s skills too.

Thanks for having me Marc Binkley and Vassilis K. Douros, loved chatting to you!

👂Listen on:

Spotify https://lnkd.in/gYGN-xfu
Apple https://lnkd.in/gMmPUwdC
YouTube https://lnkd.in/gMmPUwdC


Attention Please

📢If you want actual people to actually watch your ads, you can’t beat video with default sound on.

Whether it’s digital eye tracking, webcams mounted on top of TV sets, or even changes in the conductivity of people’s skin, the data shows that it’s cheaper to buy attention with TV and YouTube ads than anything else.

So, the conclusion is that your 2024 media plan ought to be MASSIVELY skewed towards video and avoid static content like display, posters, press, and Facebook.

Um, but is that right?

On the yes side: There is clear evidence that attention is related to prompted recall, brand choice, and a “virtual proxy for sales” – this is from 2 different sources, Lumen and Amplified Intelligence

But, on the maybe side: The same studies show that a little attention goes a long way. So, a little bit of attention from a different target audience on Facebook or Instagram might still be worth paying for, even if it costs more per second.

And on the side of “we need more research to be sure”: You might be surprised to hear that we haven’t found any studies yet that prove attention-optimised media plans are better for sales.

So, this year at magic numbers we want to work with some brilliant advertisers that want to test the attention to sales relationship.

And new year’s resolutions for marketers that come across new and exciting metrics this year is to just be a little bit sceptical before piling in.

Because you can learn a massive amount from the very long list of metrics you’ve probably already got access to.

🙌And that’s especially true if you’ve had good training on how to use those metrics, how not to be misled, and how to bring data together into a convincing and properly evidenced argument for change.

If you’ve never had that training, check out my Data Works course.

🚩Sign up by going to the courses page at the top of the screen or chat to Imogen for group bookings and questions via [email protected].

Go back to the post here: https://www.linkedin.com/posts/grace-kite_if-you-want-actual-people-to-actually-watch-activity-7161274958277492736-8GFk?utm_source=share&utm_medium=member_desktop


Superbowl 2024

🏈The Chiefs will definitely win the Super Bowl.

Get your bets in, it’s a dead cert. They always win when the moon is waxing crescent, and that’s what it’ll be when they play in Las Vegas on the big day.

🌒The data proves it. In the last 5 years, the Kansas City Chiefs have won 19 out of 20 games under waxing crescent moons. Their opponents have nowhere near the same win rate.

Now, if you’re still reading, it means you haven’t pulled out your credit card and surfed to Paddy Power yet. And that’s wise. “Football” games are won by skill, strategy, and fitness – none of which depends on the state of the moon.

And the thing is, the same is true with advertising. The brand that will get the most from their Super Bowl ad this Sunday, will do it because they got the message and creative right, and – probably – because they chose the right celebrity to feature.

But just like with the moon and the Chiefs, there are a range of things that correlate with advertising effectiveness just by utter coincidence, nothing to do with cause and effect.

And it isn’t always clear-cut. Often marketing choices that look reasonable as a cause of good outcomes correlate with effectiveness when actually they don’t help at all.

It’s not easy to be wise about cause and effect in marketing, but if you don’t want to be misled, that is something you can learn – and you don’t need to be a whizz with maths.

Our Data Works course includes a simple set of 4 questions to ask and shows you how to get the answers. And it has a lot more on what marketing people should do with numbers, how you can do it, and how to use data to persuade people to act.

🚩Sign up by going to the courses page at the top of the screen or chat to Imogen for group bookings and questions via [email protected].

Go back to the post here: https://www.linkedin.com/posts/grace-kite_the-chiefs-will-definitely-win-the-super-activity-7160550210794909696-AV2w?utm_source=share&utm_medium=member_desktop


Heg vs Cox

💩Is too much data a problem in marketing?

You may think that being the proud founder of an analytics company magic numbers, I’m never going to agree that data is a bad thing.

But actually, in many ways I agree with Sir John Hegarty when he says:

“Data has never created wealth, never. Creativity has, all the time. Because it imagines something… if you’re an organisation trying to increase your profitability, or expand your market, data is very important. But it’s creativity that will make that happen.”

But Brian Cox is right too. Things can only get better when he turns up.😉

It’s because creativity on its own can be misguided. An idea can look brilliant but just not turn out to be in line with how the world works.

Cox is right when he says data can assess the strength of ideas. It can test whether discoveries apply widely, or if they’re only useful in some weird corner of the universe.

🎨📊Marketing people need both things. Creativity which uniquely comes from people. And ways to test that creativity, which is the super-power of data.

My Data Works course includes a framework for using data in marketing that takes the best bits from what both these gents are saying. It’ll give you the power to produce plans that are going to work, and convince people in your organisation to act on them.

🚩Sign up by going to the courses page at the top of the screen or chat to Imogen for group bookings and questions via [email protected].

*John Hegarty and Brian Cox never sat in the same room to discuss it. The conversation in the picture took place over two events at Cannes: Hegarty in 2014, Cox in 2015.

Find the post here: https://www.linkedin.com/posts/grace-kite_is-too-much-data-a-problem-in-marketing-activity-7158738273727574017-spax?utm_source=share&utm_medium=member_desktop


Budget simplicity

🪙Is your budget set at the right level for 2024?

We recently did the work to establish a good rule of thumb for how to set your advertising budget relative to the size of your business if the objective is to maximise ROI.

The chart is from the ARC database – a joint initiative between the IPA (Institute of Practitioners in Advertising) and magic numbers to bring hundreds and hundreds of econometrics findings from 6 econometrics shops together.

It shows the optimal % of turnover you should devote to advertising if you’re an online business and you want to maximise ROI. It’s about 5%, and for online businesses the ROI is higher at that optimum than it is for bricks and mortar.

ℹ️But do you know what else we found? It’s that the same finding was there in 2 other reputable sources – in Nielsen’s ROI study, and in an investigation by Paul Dyson. All three studies landed on spending 5-10% of turnover on advertising for the highest return on investment.

🤓This chart is taken from my course, which is all about putting your money where the magic is. The right size budget and the right mix of brand and performance marketing.

If you like using a benchmark, meta study, or rule of thumb to make the right decisions *and* successfully sell them in to your bosses, learn more on my Scaling Up Works course starting 12th March.

🚩Sign up by going to the courses page at the top of the screen or chat to Imogen for group bookings and questions via [email protected].

Go back to the post here: https://www.linkedin.com/posts/grace-kite_is-your-budget-set-at-the-right-level-for-activity-7158013489641377792-hn8q?utm_source=share&utm_medium=member_desktop


Ramp and bump

It’s scary when the thing that’s been powering growth stops working. But that’s normal for online businesses using performance marketing.

In the early days you’re small enough that fast growth is available by reaching potential customers that are already shopping online and not loyal to a competitor.

🎣But once you’re a bit bigger, continued growth means reaching outside the readily available pool of customers, converting people who are loyal to competitors, or bringing new people into the market.

If you do that, you not only get a direct effect on sales but a synergy that improves what your performance marketing can do.

📈We’ve seen this pattern so many times, it qualifies as a model. That’s why Tom Roach and I made the ramp and bump chart here.

But it’s not easy to get the transition that’s needed right. You need different types of advertising that require different skills.

I have coached hundreds and hundreds of marketing people through it, and then packaged all that up into a super practical course, complete with frameworks, modern case studies, and simple things you can do with your own data.

▶ Learn how to do what works at every stage on the journey, with me,

🚩Sign up by going to the courses page at the top of the screen or chat to Imogen for group bookings and questions via [email protected].

Go back to the post here: https://www.linkedin.com/posts/grace-kite_its-scary-when-the-thing-thats-been-powering-activity-7153001749929238529-Ebid?utm_source=share&utm_medium=member_desktop


Introducing Data Works

To celebrate the launch of magic works, I’ve got a brand-new course for you.

💥Introducing Data Works.

In modern marketing, data matters. Because if you’re stronger with data, you’re able to see the things that are right to do.

And, if you want your ideas to be credible, convincing, and compelling you need data.

🚀But it doesn’t have to be rocket science. You can be great with data even if you didn’t like maths at school.

This course makes data doable.

It covers things you should do to make sure your marketing is the best it can be. Including…

➕ Using data wisely and avoid being misled
➖ Presenting data in an easy-to-understand way
✖️ Spotting issues scuppering your marketing
➗ Harnessing hardcore analytics

It’s hands-on, practical training that fits in with your schedule and you’ll have lots of support from me and my lovely team at magic works.

So you can get to grips with data and give your marketing the magic touch.

Tada!

🚩Sign up by going to the courses page at the top of the screen or chat to Imogen for group bookings and questions via [email protected].


Introducing Magic Works

Just because you can bring dinosaurs back to life using a bit of DNA trapped in amber, it doesn’t mean you should. 🦖

The same applies to marketing training. Just because you can write a training course and deliver it online, it doesn’t mean anyone will need it, want it or care enough to do it.

It’s something I thought about a lot in 2023. Because I can teach, I was a university lecturer for years, and I’ve been coaching marketing people since 1999. But in the crowded post-covid training landscape, who needs another course?

Being researchers, me and the team magic numbers were nerdy about it. 🤓 We asked people, tried things, and even built a statistical model.

We found out there is a genuine need not being met. Marketing training gives people knowledge, but not the skills to adapt that knowledge to their own business, or the credibility to use it convincingly.

It means people struggle to convert their training into marketing strategies that actually get used.

I designed our magic works courses to meet this need, to give marketers the practical tools and skills that help them evolve into credible experts that can get sh1t done.

I’ve written up what we learnt from doing it on our shiny new website, which also has details of our spring courses – link in comments. ⬇

Thank you so much to Nina Farrell, Asa Medhurst, Ellen Ling, Frances Brown, Joel Kite, Tashan Nicholas, Michael Buchholz Imogen Howard, Hal Webb for your work on it, and to Tom Roach, Sarah Hunt and everyone that participated in our research and pilot course for all the help and advice. You’re the best!

🚩Sign up by going to the courses page at the top of the screen or chat to Imogen for group bookings and questions via [email protected].

Read more